

How to Read Body Data Correctly: A Guide to Health & Nutrition
TL;DR:
- BMI is a useful but limited metric for assessing body weight, as it does not differentiate between fat and muscle mass. Better indicators of health are waist circumference and waist-to-height ratio, which reflect fat distribution. Body composition and individual factors, such as visceral fat and hormonal changes, determine the actual risk and should be considered in health checks.
BMI is the most widely used metric globally for assessing body weight—and at the same time, one of the most misleading. People with a supposedly normal BMI can have an increased risk of diabetes, heart disease, or metabolic problems, while someone with a formally elevated BMI of 27 can be perfectly healthy. If you truly want to understand your health, you need to look deeper: into fat distribution, muscle mass, body water, and individual metabolic processes. This guide shows you which body data really matter, how to measure them correctly, and what they mean for your diet and daily life.
Table of Contents
- Fundamentals and Limitations of Key Body Data
- Understanding Body Composition Holistically
- Tracking and Analyzing Body Data Systematically: Practice & Sources of Error
- Individual Differences and Special Cases – The Big Picture
- Application: Adapting Diet and Lifestyle to Body Data
- Why Numbers Are Just the Beginning: Our Practical Conclusion
- Next Steps: Your Personal Health Analysis with mybody®x
- Frequently Asked Questions on Interpreting Body Data Correctly
Key Takeaways
| Point | Details |
|---|---|
| BMI alone is not enough | Combine different values to get an accurate picture of your health. |
| Regular tracking is crucial | Consistent measurements under the same conditions significantly increase reliability. |
| Consider individual characteristics | Exercise, age, and hormones significantly influence the interpretation of your body data. |
| Adjust diet specifically | Focus on protein and calories to actively improve your values. |
| Remain calm | Not individual numbers, but long-term trends are the foundation of your health. |
Fundamentals and Limitations of Key Body Data
The first step to interpreting your body data is an honest look at what common metrics actually do—and what they hide.
BMI: Useful, but limited
The Body Mass Index is calculated according to the WHO classification as weight in kilograms divided by height in meters squared. Normal weight is between 18.5 and 24.9. Overweight begins at 25, obesity at a value of 30 or higher. This sounds precise. However, BMI does not differentiate between fat mass and muscle mass, between body regions, or between genetically determined differences in fat distribution.
A professional boxer weighing 90 kg and measuring 185 cm has the same BMI as an untrained office worker with the same measurements. Both fall around 26.3, placing them in the "overweight" category. However, their risk profiles could hardly be more different.
Waist circumference and WHtR as better complements
Better than BMI alone are waist circumference and the so-called Waist-to-Height Ratio (WHtR). The WHtR is calculated by dividing waist circumference by height. A value below 0.5 is considered normal according to risk values from the ADAC health guide. If the WHtR rises above 0.5, the cardiovascular risk increases. This value takes into account where fat accumulates, thus providing a much more realistic assessment.
“Waist circumference is often more indicative than body weight because it directly points to abdominal fat—the fat depot with the highest risk potential.”
Which values should you know?
- BMI: a rough guide, insufficient as a sole metric
- Waist circumference: >94 cm (men) and >80 cm (women) signals increased risk
- WHtR: ratio of waist to height, target value below 0.5
- Body Fat Percentage (BFP): percentage of fat mass in the body
- Muscle mass: proportion of skeletal muscle in total weight
- Water content: body water as an indicator of hydration and cell function
Pro tip: Always measure your waist circumference on an empty stomach immediately after waking up, at the level of the navel, with normal exhalation. Deviating measurement points can shift the result by several centimeters.
If you want to measure your body fat percentage, you can now find simple methods for home use. Scales with bioelectrical impedance analysis (BIA) provide initial usable estimates, provided measurement conditions are kept constant.
Understanding Body Composition Holistically
Once you know what values exist, the real work begins: understanding the correlations.
Visceral versus subcutaneous fat
Not all fat is equally dangerous. Subcutaneous fat lies directly under the skin and is physiologically normal and even necessary in certain amounts. Visceral fat, however, accumulates around the internal organs. It is metabolically active and releases inflammatory substances. Elevated visceral fat is associated with a higher risk of diabetes and heart disease and is considered one of the most important preventable risk factors for metabolic diseases.
Visceral fat cannot be seen or felt directly. The abdominal area may feel firm, even though high amounts of fat are present internally. Newer generation BIA devices and especially DEXA measurement (Dual Energy X-ray Absorptiometry) can make this fat visible.

Normal ranges for muscle mass and water content
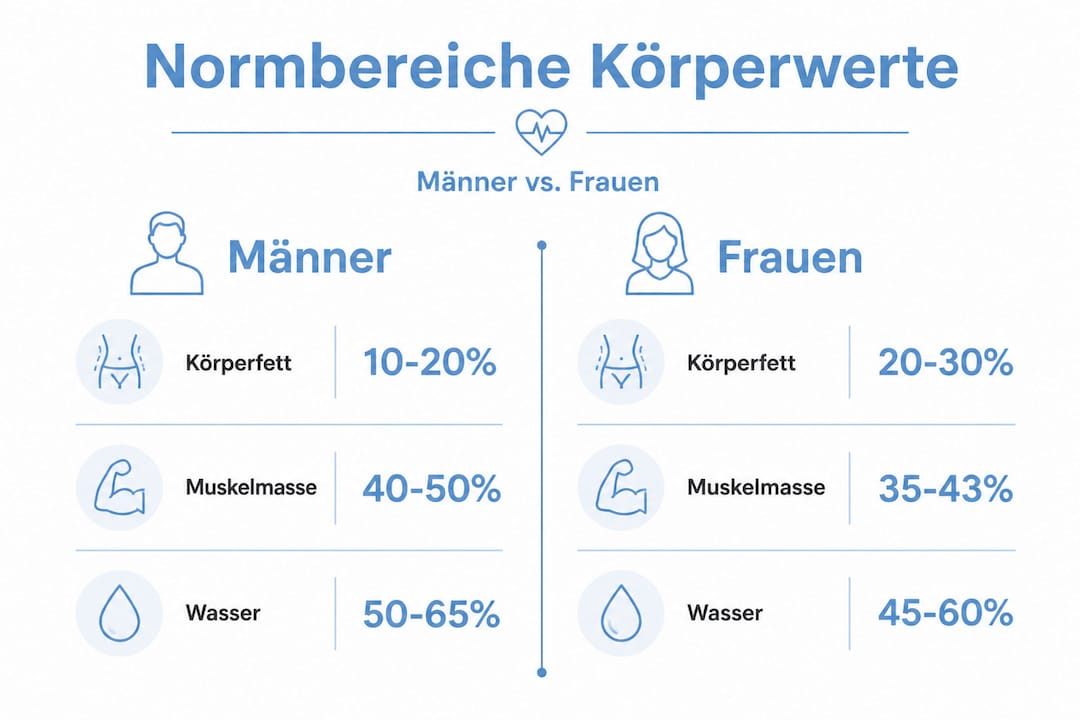
According to available health data, the healthy muscle mass percentage for men is 40 to 50 percent of body weight, and for women, 30 to 40 percent. Water content should be between 50 and 65 percent, with well-trained individuals often at the higher end of this range, as muscles store more water than fat tissue.
| Metric | Men's Normal Range | Women's Normal Range |
|---|---|---|
| Body Fat Percentage | 10-20 % | 20-30 % |
| Muscle Mass | 40-50 % | 30-40 % |
| Water Content | 55-65 % | 50-60 % |
| Visceral Fat (BIA Scale) | Level 1-9 normal | Level 1-9 normal |
BIA versus DEXA: What the methods achieve
BIA scales send a weak alternating current through the body and estimate fat mass, muscle mass, and water content based on resistance. They are inexpensive, easy to use, and suitable for regular tracking. However, they are sensitive to hydration status. Someone who measures well-hydrated in the morning will get different values than after a strenuous workout.
DEXA measurements are considerably more precise. They use X-rays and can millimeter-accurately segment body fat, muscle mass, and bone density, even for individual body regions. A DEXA scan usually costs between 80 and 150 euros and is increasingly offered in specialized health centers. For an annual in-depth diagnosis, it is the most accurate available option outside clinical settings.
A well-founded metabolism analysis guide shows how these data can be combined with genetic information to get a complete picture. And if you want to know whether genetic factors play a role in your weight, the DNA analysis for weight loss provides a data-driven starting point.
“Body composition data is not a one-time diagnosis – its value unfolds over time and in the context of your lifestyle habits.”
Tracking and Analyzing Body Data Systematically: Practice & Sources of Error
Knowledge about values is of little help if the measurements themselves are unreliable. Consistency beats precision when it comes to everyday tracking.
Overview of the most common measurement errors
| Source of Error | Possible Impact | Avoidance Strategy |
|---|---|---|
| Measuring after exercise | Reduced body water, falsified BFP | Always measure in the morning, on an empty stomach |
| Varying times of day | Up to 2 kg weight difference is normal | Choose a fixed time, ideally in the morning |
| Fluctuating hydration status | Muscle mass and fat appear altered | Do not drink anything 2 hours before measurement |
| Hormonal cycle phase | Water retention up to 3 kg possible | Document cycle day, look at trends instead of individual values |
| Device change | Different algorithms provide deviating values | Always use the same device |
Step by step: Building your own tracking system
- Choose a reliable measuring device: A BIA scale with a smartphone app is sufficient for most people. What matters is not absolute precision, but consistency over weeks.
- Establish fixed measurement conditions: In the morning after the first visit to the toilet, before breakfast, without shoes, and in the same clothing. Adhering to these conditions according to tracking recommendations under consistent circumstances is crucial for meaningful comparisons.
- Document more than just weight: Also record sleep quality, stress levels, calorie intake, and training sessions. Without context, body data are difficult to interpret.
- Analyze trends over at least four weeks: Daily fluctuations of one kilogram are biologically normal. Only the progression over several weeks shows real changes.
- Compare your data with personalized benchmarks: Normative values from literature are starting points. Your personal baseline and the direction of change are more indicative than comparing with averages.
Pro tip: If you are informed about weight loss with DNA analysis, you know that genetic factors largely determine how well a body responds to low-carb, low-fat, or strength stimuli. Building a diet plan without this information is like navigating without a map.
Don't store your measurement data in your head, but in an app or a simple spreadsheet. This way, you will recognize patterns that remain invisible when viewed individually.
Individual Differences and Special Cases – The Big Picture
Standard values are guides. But for many people, they fall short.
Athletes: When good numbers look bad
A strength athlete weighing 88 kg and measuring 178 cm has a BMI of 27.7, which is clinically "overweight." His body fat percentage is 12 percent. The problem is the BMI, not the athlete. According to analyses of special cases in body measurements, athletes regularly have formally elevated BMI values despite extremely low body fat percentages. The BMI was never developed for competitive athletes.
The TOFI phenomenon: Thin but risky
Even more insidious is the opposite case. TOFI stands for "Thin Outside, Fat Inside." People with a normal BMI and slender appearance can accumulate significant amounts of visceral fat without knowing it. This particularly affects people with a predominantly sedentary lifestyle and poor nutritional quality, but moderate body weight. Their organs are surrounded by fat that remains invisible on the scale or in the mirror.
“Being thin does not automatically protect against metabolic risks. Those who forgo body composition analysis and only look at weight may overlook the most dangerous aspects.”
Hormones and life stages as confounding variables
Women in menopause often experience a shift in fat distribution. Declining estrogen levels promote fat storage in the abdominal area, regardless of calorie intake or physical activity. This hormonally induced fat redistribution makes classic normal values harder to interpret. For those who want to learn more about estrogen deficiency and weight gain, important background information can be found there.
The same applies to men with low testosterone, people with thyroid disorders, or individuals after long periods of elevated cortisol due to stress. Those who only consider weight or BMI do not see these connections. More about the links between belly fat and metabolism is offered in an in-depth article.
The role of hormones extends beyond fat distribution. Insulin, glucagon, and cortisol directly control where energy is stored and retrieved. Understanding one's hormonal blood sugar dynamics allows for much more targeted nutrition and training strategies.
Application: Adapting Diet and Lifestyle to Body Data
Data without an action plan remain just numbers on a screen. This is where information becomes guidance.
- Determine your starting point: Measure all relevant values under consistent conditions. Note BMI, waist circumference, WHtR, and if possible BFP and muscle mass.
- Define a realistic goal: Not "lose weight," but specifically: "Reduce visceral fat level from 12 to below 9" or "Increase muscle mass by 3 kg in four months." Measurable goals allow for clear progress monitoring.
- Set protein targets based on your muscle mass: According to evidence-based body recomposition research, the optimal range for muscle building is 1.6 to 2.2 grams of protein per kilogram of body weight daily. With a simultaneous calorie deficit, the upper limit is more beneficial.
- Adjust calorie intake to the goal: Body recomposition, i.e., simultaneous muscle building and fat loss, is possible especially for beginners and overweight individuals. A moderate deficit of 200 to 400 calories daily is more effective in such cases than extreme calorie reduction.
- Adapt training stimuli to your current values: Those with little muscle mass benefit more from strength training than from endurance sessions. Those with good muscle mass can specifically reduce visceral fat with interval training.
- Check every four weeks: Compare your measurements and adjust strategies. Non-linear change is a signal, not a defeat.
Pro tip: Anyone who is informed about weight loss with DNA analysis knows that genetic factors significantly determine how well a body reacts to low-carb, low-fat, or strength stimuli. Building a nutrition plan without this information is like navigation without a map.
Avoiding typical adaptation mistakes
Many people start with too many changes at once. They drastically cut calories, start exercising daily, and eliminate entire food groups. The result: the body reacts with stress hormone release, muscle loss, and exhaustion, and body data even temporarily worsens. Precise, gradual adjustments are always more effective than radical cuts. And adequate protein intake has been proven to protect muscle mass better than any other single dietary measure during deficit phases.
Why Numbers Are Just the Beginning: Our Practical Conclusion
We work daily with people who want to optimize their health based on numbers. And we have learned: The most common mistake is not measuring the wrong values. The most common mistake is attaching too much importance to a single value.
Anyone who finds their BMI is 27 and then panics has misunderstood the BMI. Anyone who performs a BIA measurement and considers the value absolute has misunderstood the method. BIA is practical but hydration-dependent, while DEXA is more precise but more expensive and less accessible. Both methods have their place; neither completely replaces the other.
What really matters is the trend. Anyone who observes over six months that their waist circumference is decreasing, their muscle mass is growing, and their energy level is increasing has done everything right, even if their BMI remains unchanged. Body data are tools, not judgments. They show directions, not endpoints.
Another aspect we consistently observe in practice: People who are successful in the long term treat their body data with professional curiosity rather than emotional reaction. Poor measurements on Monday morning after a stressful weekend do not mean disaster. They mean: sleep, hydration, and cortisol influenced the measurement.
The Health Analysis Guide offers further insights into how systematic analyses can permanently sharpen the perception of one's own body.
We therefore always recommend to our clients: Start with a solid data basis. Supplement it with genetic and biochemical analyses where appropriate. And then stop questioning every number. Observe patterns. Act based on trends. Stay curious, but stay calm.
Next Steps: Your Personal Health Analysis with mybody®x
Interpreting body data is a craft that can be significantly improved with the right tools. mybody® offers exactly that: scientifically validated analyses for DNA, metabolism, nutrient supply, and hormones, which you can conveniently perform from home. Instead of projecting general norm tables onto your body, you receive answers tailored to your biological reality. All analyses are carried out in ISO-certified laboratories with the highest data protection standards. Discover the right analyses for your goals on mybody®x and lay the foundation for data-driven, sustainable health optimization today.
Frequently Asked Questions About Interpreting Body Data Correctly
How often should I measure my body data?
Weekly measurements at fixed times of day are optimal because they show reliable trends without overemphasizing daily biological fluctuations. Consistent measurement conditions are more important than high measurement frequency.
Why is BMI not sufficient?
BMI completely ignores fat distribution and muscle mass and should always be supplemented with waist circumference or body fat percentage. As a pure screening tool, it can provide initial indications, but nothing more.
How do I recognize dangerous belly fat?
A waist circumference over 94 cm for men or over 80 cm for women, as well as a WHtR over 0.5, are considered warning signs for an increased metabolic risk due to abdominal fat.
How can I improve my body data?
Sufficient protein according to benchmarks for muscle building between 1.6 and 2.2 grams per kilogram of body weight daily, combined with regular strength and endurance training and a moderate calorie deficit, sustainably improves body composition.
What is the difference between visceral and subcutaneous fat?
Visceral fat accumulates around the internal organs and significantly increases the risk of diabetes and heart disease more than subcutaneous fat, which is harmless under the skin and has hardly noticeable metabolic effects in everyday life.
Recommendation
- Test for nutrient deficiencies: Recognize symptoms & specifically address deficiencies – mybody®x
- Health optimization: 70% don't benefit from standards – mybody®x
- Optimize nutrition based on test results: Step-by-step guide – mybody®x
- What is my metabolism type? Discover your path to optimal nutrition – mybody®x
- Unlock body temperature trends for early illness detection – Smartlet


Share:
Recognize Stress Symptoms and Effectively Counter Them
Gut Cleanse: Your 4-Week Plan for a Healthy Gut