

The LDL-to-HDL ratio: what it actually says
The essentials at a glance
The idea behind a ratio is correct: Relating two values to each other says more than a single number alone. The commonly used quotient, however, is not the one named in the sources reviewed.
IQWiG identifies non-HDL cholesterol—that is, total cholesterol without HDL—as the best predictor of heart and vascular health. As an alternative, it names the quotient of total cholesterol and HDL (as of 2025-08-06). An LDL-to-HDL quotient is not mentioned there.
You will first read what a quotient actually shows. This is followed by a comparison of the measures, the statement from the authoritative source, the calculation itself, the underlying numbers, and what a ratio cannot answer either.
What to expect in this article
1. Why use a ratio at all?
2. What a quotient shows
3. The measures compared
4. Why LDL to HDL in particular is so widespread
5. The statement from the authoritative source
6. A subtraction instead of a division
7. What is established about the LDL-to-HDL quotient
8. Why a ratio is not enough either
9. The numbers on which every calculation is based
10. What you need for the calculation to work
11. Who can benefit from a measurement
12. What a capillary blood test can show here
13. Limitations: what a ratio also leaves unanswered
14. What matters about the ratio
Frequently asked questions
Sources
Why use a ratio at all?
The idea behind a ratio is easy to understand, and it arises naturally when reading any test report.
Two people can have the same total cholesterol level and still have a very different distribution behind it. In one person, much of it is in the HDL; in the other, little is, and the first line of the test report looks the same in both cases.
A ratio makes precisely this difference visible. It describes the distribution, not the amount.
In that sense, looking for a quotient is justified. The only question is which quotient is given in the sources—and the answer is surprising.
What a quotient shows
A ratio is obtained by dividing one value by another. As a result, it has a characteristic that is often overlooked in everyday life: It strips away information.
A quotient of three can result from 150 divided by 50 or from 90 divided by 30. The same number appears in both cases, even though the original values differ considerably.
This is not a flaw in the calculation, but its purpose. It is meant to show the distribution, not the amount.
What this means for reading the results
That is why anyone using a quotient still needs the original values. The ratio supplements them; it does not replace them.
And it needs context. A number without a reference value is not a statement, but a calculation result.
The measures compared
The table compares four measures, all of which claim to say more than a single value. It provides context and does not constitute a diagnosis.
| Calculated measure | How it is calculated | What the sources reviewed say about it | What it does not accomplish |
|---|---|---|---|
| Non-HDL cholesterol | Total cholesterol minus HDL cholesterol | Considered the best predictor of heart and vascular health; many risk calculators use it (IQWiG, as of 06/08/2025) | A risk assessment without the other factors |
| Total cholesterol divided by HDL | Dividing the first test-result line by the third | Sometimes used as an alternative according to IQWiG (as of 06/08/2025); the source does not provide a numerical interpretation | The magnitude of the initial values, because the quotient cancels them out |
| LDL divided by HDL | Dividing the second test-result line by the third | No statement in the sources reviewed—neither a recommendation nor a numerical interpretation | Everything that cannot be stated without a documented reference value |
| LDL as an individual value | Directly from the test result, without calculation | One of several risk factors; personal risk can only be estimated when all factors are considered together (IQWiG, as of 03/20/2025) | The breakdown, because it describes only one transport form |
The third line is the most inconvenient, and it is the reason for this article. The quotient most frequently calculated online is the only one of the four for which we found nothing in the sources reviewed.
Why LDL-to-HDL is so widespread in particular
It is understandable that this particular calculation has become established, even without supporting evidence.
It draws on the two lines that are commonly regarded as counterparts in everyday life. If you bear in mind that one transport form carries substances into the body and the other back to the liver, you intuitively divide one by the other.
Both lines also appear on every test result. The quotient can therefore be calculated without additional information, which makes it attractive for online calculators.
Why this is not yet confirmation
Prevalence and supporting evidence are two different things. A calculation does not become reliable merely because many people perform it.
This does not mean that the LDL-to-HDL ratio is wrong. It means that we found no basis in the sources reviewed for interpreting it—and without interpretation, a number cannot be understood.
If you encounter such a quotient in a test result or an evaluation, it should therefore be discussed with the practice that issued the result.
The sentence from the authoritative source
Instead of a quotient, IQWiG identifies a different calculated measure, using unusually clear wording.
Documented source
“This is total cholesterol excluding HDL cholesterol. This value is considered the best predictor of heart and vascular health because, in addition to LDL cholesterol, it also includes the other harmful variants.”
Institute for Quality and Efficiency in Health Care
IQWiG, gesundheitsinformation.de, Elevated cholesterol levels, as of 06/08/2025
This refers to non-HDL cholesterol. The second sentence explains why it covers more than LDL alone: In addition to LDL, it includes the other variants.
The same source adds that many risk calculators use this value to determine a person’s cardiovascular risk, and that the ratio of total cholesterol to HDL cholesterol is sometimes used as an alternative (as of August 6, 2025).
Regarding the calculators themselves, IQWiG states that they are best used together with a doctor (as of August 6, 2025). This is not a formal add-on; it is part of the statement itself.
Subtraction instead of division
What is remarkable about non-HDL cholesterol is that it is not a ratio at all. It is produced by subtraction, not division.
Total cholesterol minus HDL cholesterol—that is all there is to it. Anyone whose test report includes both values already has the result, even if it is not printed as a separate line.
Why the type of calculation makes a difference
Subtraction retains the unit. The result is still expressed in milligrams per deciliter or millimoles per liter and can be read using the same standards as the original values.
Division removes the unit. The ratio is a pure number, and without an established interpretation, a pure number says nothing.
This explains part of the difference in the evidence. A value that retains its unit can be linked more easily to existing reference values than one whose units cancel out.
What is established about the LDL-to-HDL ratio
This is where the research findings appear, and they are shorter than expected.
The ratio that almost everyone calculates is not the one named by the sources. The underlying idea is still sound.
In the sources we reviewed, we found no statement about the LDL-to-HDL ratio: no recommendation, numerical classification, threshold, or warning against using it.
What is established is that non-HDL cholesterol is the best predictor, with the ratio of total cholesterol to HDL as an alternative (IQWiG, as of August 6, 2025). Neither is the same as LDL divided by HDL.
This gap is itself information. Naming it is more honest than taking a number from a source that does not provide one for this purpose.
Why a ratio is not enough either
Even the established approach using non-HDL cholesterol does not lead to a risk assessment at the kitchen table, and there is a structural reason for that.
IQWiG states that an elevated LDL level is one of several risk factors and that personal risk can only be estimated when all factors are considered together (as of March 20, 2025). These include smoking, age, sex, and pre-existing conditions such as diabetes, high blood pressure, or impaired kidney function.
None of these factors appears in the blood lipid panel. A calculation that uses only the rows from this panel therefore cannot include them, regardless of how it is constructed.
There is also variation. Even in healthy people, total cholesterol levels can vary by ten percent within 24 hours (MSD Manual, professional edition, as of December 2025). A quotient of two fluctuating values fluctuates as well.
The extent of this fluctuation and what it means for two measurements is discussed in the companion article Cholesterol levels change more slowly than many expect.
The figures underlying every calculation
Three figures, each with a source and date. They show why the breakdown is a question at all.
Documented proportions and classifications
over ⅔
Proportion of LDL cholesterol in blood cholesterol (IQWiG, as of 20 March 2025)
about ¼
Proportion of HDL cholesterol in blood cholesterol (IQWiG, as of 20 March 2025)
below 40
mg/dl HDL, corresponding to 1.0 mmol/l: classified as unfavorable by IQWiG (as of 6 August 2025)
The first two figures together still do not make up the full total. That exact remainder is why non-HDL cholesterol covers more than LDL alone.
And as with every laboratory value, the reference range stated on your own test result is decisive, because reference values may vary from one laboratory to another (IQWiG, as of 2 April 2025).
What you need for the calculation to work
Each of the calculation measures mentioned requires the underlying values to be available. That may sound obvious, but it is not in practice.
To calculate non-HDL cholesterol, you need total cholesterol and HDL. If either line is missing, the value cannot be calculated, even approximately.
A measurement device that reports only total cholesterol is therefore not sufficient. It provides the first line, not the third.
And the conditions of the sample
For triglycerides, IQWiG recommends not eating anything during the eight hours before the blood sample is taken and drinking only still water, because a meal can increase the value (as of 20 March 2025). According to the same source, meals have little effect on LDL.
For a comparison over time, this means that two calculations are comparable only when the underlying samples were taken under the same conditions. The instructions for the respective test are decisive.
Who may benefit from a measurement
The comparison refers to the complete lipid profile as the basis for every calculation.
It makes sense for you if …
Your test result does not include HDL, so you cannot calculate any of the ratios.
You have only known your total cholesterol so far, for example from a single measurement.
You want to establish a complete baseline with a date against which something can be compared later.
You want to bring all four lines to a conversation at the doctor’s office instead of just one.
Probably not, if …
You hope to obtain a risk assessment from a ratio. Other factors beyond the laboratory also count for that.
You are looking for an interpretation of the LDL-to-HDL ratio. The reviewed sources provide none.
You had a measurement a few weeks ago. A ratio based on fluctuating values fluctuates too.
You expect a diagnosis. That is provided by a medical practice, not a self-test.
What a capillary blood test can show here
A capillary blood self-test does not provide a diagnosis, calculate a risk score, or replace a consultation. What it can do is provide the baseline values without which none of the calculation metrics mentioned can be derived.
Three tests from mybody®x (MYBODY Lab GmbH) include total cholesterol and HDL together: the VitalCheck, the Men's Wellness Check, and the Women's Wellness Check. The VitalCheck serves as the representative example here.
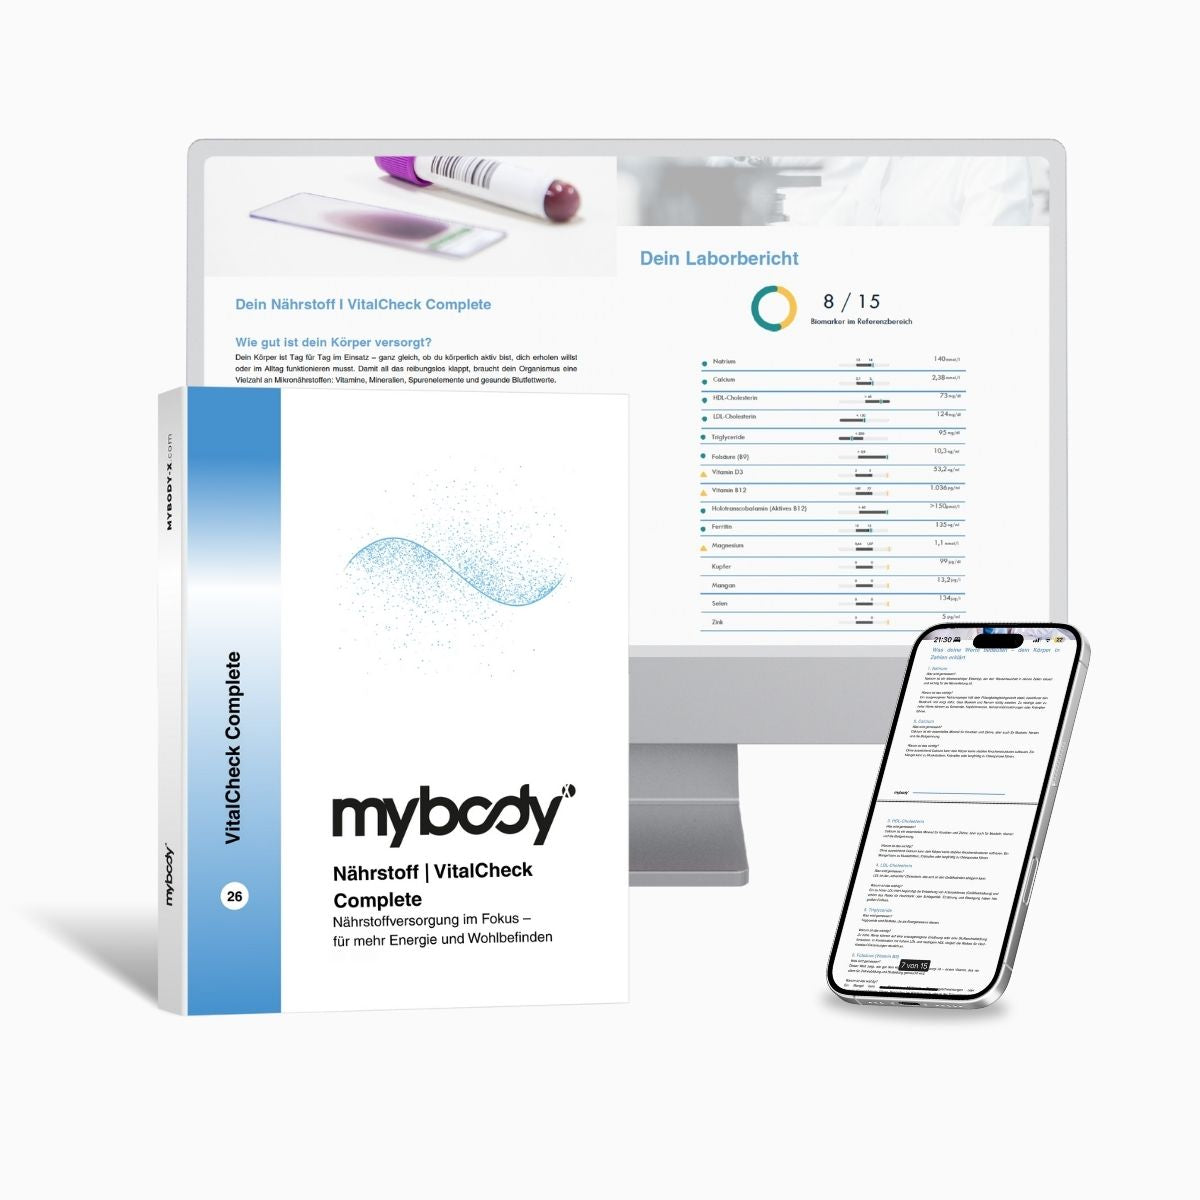
Capillary blood test
VitalCheck | Nutrient & Mineral Test Complete
Includes 18 values, including all four blood lipids: total cholesterol, HDL, LDL, and triglycerides. It also includes ferritin, iron, transferrin, vitamin B12, folic acid, vitamin D, HbA1c, CRP, albumin, as well as calcium, magnesium, phosphate, selenium, and zinc. What the test does not provide: it neither reports non-HDL cholesterol nor any ratio as a separate line, does not estimate cardiovascular risk, does not provide a diagnosis, and does not replace a medical examination.
Laboratory results 3–5 business days after sample receipt
Product page information, accessed 15/08/2026
Four points determine whether a calculation becomes useful information.
Include both lines
Without total cholesterol and HDL, none of the calculation metrics can be derived.
Retain the baseline values
A ratio accompanies the individual values; it does not replace them.
Keep the conditions consistent
Two calculations based on samples collected under different conditions are not comparable.
Discuss the interpretation
According to IQWiG, risk calculators belong in a conversation with a medical practice.
Chapter at a glance
A capillary blood self-test provides the baseline values for each of the calculation metrics mentioned and does not constitute a diagnosis. It does not calculate any ratio itself. Four points are crucial: include both lines, retain the baseline values, keep the conditions consistent, and discuss the interpretation.
Limitations: what a ratio still leaves open
The first limitation is the evidence base. We found no statement on the LDL-to-HDL ratio in the sources reviewed, and this article does not invent one.
The second limitation is the lack of interpretation. Even for the documented ratio of total cholesterol to HDL, IQWiG does not state any figures at which something is considered favorable or unfavorable (as of 06/08/2025).
The third limitation is the factors outside the laboratory. Smoking, age, sex, and pre-existing conditions are part of the risk assessment and do not appear on any test result line (IQWiG, as of March 20, 2025).
The fourth limitation is diagnosis. All the classifications in this article provide context and do not constitute a diagnosis. A diagnosis is made in a medical practice, and no self-test can anticipate it.
What matters about the ratio
If you take away just one thing from this article, let it be this: The idea of relating two values to each other is sound. The common implementation is not supported by evidence.
Non-HDL cholesterol, calculated as total cholesterol minus HDL, is supported by evidence, as is the alternative ratio of total cholesterol to HDL (IQWiG, as of August 6, 2025). We found nothing about the LDL-to-HDL ratio.
It began with the question of what the ratio tells us. The honest answer is: It says something about the distribution and nothing about risk. Assessing risk requires more than the blood lipid panel.
Frequently asked questions
How is the LDL-to-HDL ratio calculated?
Mathematically, LDL cholesterol is divided by HDL cholesterol. However, we found no statement about this calculated value in the sources we reviewed: no classification, threshold, or recommendation. Instead, IQWiG names non-HDL cholesterol and, as an alternative, the ratio of total cholesterol to HDL (as of August 6, 2025).
What is non-HDL cholesterol?
Total cholesterol minus HDL cholesterol. IQWiG describes this value as the best predictor of cardiovascular health because, in addition to LDL cholesterol, it contains the other harmful variants, and points out that many risk calculators use it (as of August 6, 2025). It is obtained by subtraction and therefore retains the unit used in the test result.
Does a ratio tell you more than a single value?
It tells you something different. A ratio describes the distribution and cancels out the magnitude of the original values: 150 divided by 50 gives the same result as 90 divided by 30. That is why a ratio appears alongside the test results rather than replacing them.
Which values do I need for the calculation?
For non-HDL cholesterol, you need total cholesterol and HDL; for the documented ratio, you need the same two values. If one is missing, the value cannot be calculated. A single measurement that reports only total cholesterol is not sufficient.
Can I assess my risk myself using this?
No. IQWiG states that personal risk can only be estimated when all factors are considered together, including smoking, age, sex, and pre-existing conditions (as of March 20, 2025). The same institution writes that risk calculators are best used together with a doctor (as of August 6, 2025).
Next step
Have the complete initial values
None of the calculated values mentioned can be determined without total cholesterol and HDL. VitalCheck measures both together with LDL, triglycerides, and 14 other values from capillary blood. It does not calculate a ratio itself, does not provide a diagnosis, and does not replace medical evaluation.
Go to VitalCheckRead more
You might also be interested in this
What each of the four numbers describes and what it leaves open on its own.
The existing article on low HDL as an individual value.
Sources
- Institute for Quality and Efficiency in Health Care (IQWiG): Elevated cholesterol levels, as of 06.08.2025 – gesundheitsinformation.de
- IQWiG: LDL cholesterol, as of 20.03.2025 – gesundheitsinformation.de
- IQWiG: HDL cholesterol, as of 20.03.2025 – gesundheitsinformation.de
- IQWiG: Triglycerides, as of 20.03.2025 – gesundheitsinformation.de
- IQWiG: Understanding laboratory values correctly, as of 02.04.2025 – gesundheitsinformation.de
- MSD Manual, Professional Edition: Dyslipidemia, Davidson MH and Altenburg M (complete review May 2025, last updated December 2025) – msdmanuals.com
The verbatim quote on non-HDL cholesterol, the information on risk calculators, the note about the alternative ratio of total cholesterol to HDL, the classification of HDL below 40 mg/dl as unfavorable, and the sentence about using it together with a medical practice are taken from source [1]. The information that LDL accounts for more than two thirds, the list of other risk factors, and the note that meals have little effect on LDL levels are taken from [2]. The information that HDL accounts for approximately one quarter is taken from [3]. The information about the eight hours before blood sampling is taken from [4]. The explanation of the reference range is taken from [5]. The information about a ten percent fluctuation within 24 hours is taken from [6]. The fact that these sources contain no information on the ratio of LDL to HDL is explicitly identified in the text as a research finding. Information on price, values, sample type, and laboratory comes from the mybody®x product page, accessed on 15.08.2026; processing times follow the central specification for blood tests. All sources were accessed and reviewed on 15.08.2026.

mybody®x Editorial & Specialist Team
Laboratory diagnostics Blood analysis interpretation Nutritional science Nutrigenetics
This article was created by the mybody®x editorial and specialist team. The team combines laboratory diagnostics, nutritional science, and the interpretation of blood analyses. Everyone involved is listed on the authors' page.
Published on 15.08.2026 · Last updated on 15.08.2026
The content is for general information and does not replace medical advice, diagnosis, or treatment. Reference ranges depend on the laboratory, method, and age—always follow the information on your test report.




Share now:
Sweeteners and blood sugar: what has been proven
Thyroid and weight: what the sources show