

Understanding and Improving Your Health Metrics
TL;DR:
- More than 61% of men and 38% of women in Germany are overweight, often without knowing their blood values.
- Blood values such as cholesterol, blood sugar, and CRP are crucial for health prevention and individual optimization.
- Combining BMI, body fat measurement, and basal metabolic rate provides a more comprehensive picture of physical health.
More than 61% of men and 38% of women in Germany are overweight, yet most do not know their own blood values, basal metabolic rate, or body fat percentage. However, these very numbers are the key to precisely managing diet, weight, and vitality. If you don't know where you stand, you're optimizing blindly. This article provides a systematic overview of the most important health metrics, explains their significance in everyday life, and shows how you can achieve concrete improvements with scientifically sound methods.
Table of Contents
- Important Health Metrics and Their Significance
- BMI and Body Fat Percentage: Opportunities and Limitations of Classic Indicators
- Basal Metabolic Rate and Calorie Needs: What Your Body Truly Consumes
- Nutrient Profiles and Healthy Eating: Limit Values and Optimization
- Why Single Readings Don't Count and Personalization Will Be Standard in the Future
- Test Your Health Metrics Easily and Individually
- Frequently Asked Questions About Health Metrics
Key Insights
| Point | Details |
|---|---|
| Blood values as a basis | Important lab values provide early indications of health risks. |
| Categorizing BMI and fat percentage | BMI only roughly indicates risk – body fat and distribution complete the picture. |
| Measuring calorie needs individually | Formulas help, but accurate measurements provide a better roadmap for diet and weight. |
| Considering nutrient profile | Promoting fiber and limiting sugar, salt, and fat demonstrably improves values. |
| Continuity instead of single values | Regular monitoring of values enables targeted, personal optimization. |
Important Health Metrics and Their Significance
Blood is a carrier of information. It reflects how well your body is working, whether inflammation is present, how organs are functioning, and whether you are adequately supplied with nutrients. A comprehensive blood count provides several crucial sub-values.
The blood count includes leukocytes (white blood cells, normal range 4.0 to 10.0 G/l), erythrocytes (red blood cells, 4.2 to 5.4 T/l in men), and hemoglobin (oxygen transport, 13.5 to 17.5 g/dl in men). Deviations can indicate infections, anemia, or chronic diseases. Normal ranges for central blood values vary depending on age, sex, and the laboratory method used, which is why comparisons should always be read in the context of one's own report.
The following parameters are particularly insightful for prevention:
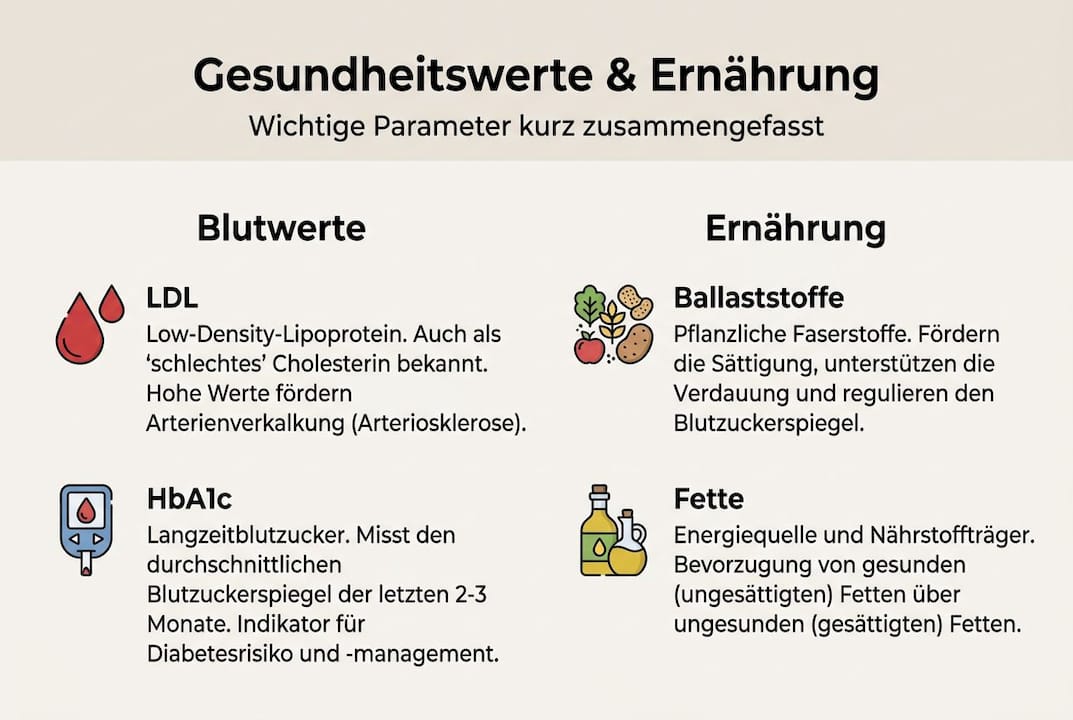
- Total cholesterol: Should be below 200 mg/dl. LDL ("bad" cholesterol) below 130 mg/dl, HDL ("good" cholesterol) above 40 mg/dl in men.
- Fasting blood sugar: Normal range 70 to 100 mg/dl. Values above 126 mg/dl indicate diabetes.
- Liver values (GOT, GPT, GGT): Elevated values can indicate fatty liver, alcohol consumption, or medication side effects.
- Kidney values (creatinine, urea): Show how well the kidneys filter waste products.
- Ferritin: Iron stores, relevant for energy and performance.
An often underestimated marker is C-reactive protein (CRP). It is an inflammation marker in the blood that increases with acute infections, but also with chronic low-grade inflammatory processes. C-reactive protein values above 5 mg/l are considered elevated and should be medically clarified. For cardiovascular health prevention, highly sensitive hsCRP is increasingly used, as it detects even minor inflammatory reactions.
Important: Laboratory norms are not rigid limits, but statistical guidelines. A value just outside the normal range does not automatically mean a disease. What is decisive is the development over time and the overall picture of all parameters.
| Parameter | Normal Range | Significance |
|---|---|---|
| Leukocytes | 4.0 to 10.0 G/l | Immune defense |
| Hemoglobin (men) | 13.5 to 17.5 g/dl | Oxygen transport |
| LDL Cholesterol | below 130 mg/dl | Heart risk |
| Fasting Blood Sugar | 70 to 100 mg/dl | Sugar metabolism |
| CRP | below 5 mg/l | Inflammation status |
BMI and Body Fat Percentage: Opportunities and Limitations of Classic Indicators
Anyone who knows their blood values should also be able to assess their weight and body structure. Both aspects complement each other and together provide a more complete picture of health.

The Body Mass Index (BMI) is the most well-known standard value for weight assessment. It is calculated from body weight in kilograms divided by the square of height in meters. The normal range is 18.5 to 24.9. Values between 25 and 29.9 are considered overweight, and 30 and above is obesity. The fact that 61% of men and 38% of women in Germany are overweight shows how widespread the problem is.
However, the BMI has clear weaknesses. It does not differentiate between muscle and fat tissue. A strength athlete with high muscle mass can have a BMI of 27 and still be very healthy. Conversely, an older person with a normal BMI can have a dangerously high body fat percentage because muscle mass decreases with age. This phenomenon is called sarcopenic obesity and cannot be detected by BMI alone.
The following methods are suitable for a more accurate assessment:
- BIA (Bioelectrical Impedance Analysis): Measures body fat percentage via electrical resistance. Easy to use, but with an error rate of ±3 to 5%.
- DEXA (Dual-Energy X-ray Absorptiometry): Gold standard for body composition, measures fat, muscle, and bone density separately. Very precise, but only available in medical facilities.
- Waist-to-hip ratio: Simple measurement that detects abdominal fat, which is particularly dangerous for the heart.
"BMI is a good starting point, but not an endpoint. If you really want to know what your body is made of, you need more than one number."
Pro Tip: Always use BIA measurements at the same time of day, after waking up and before breakfast, to get comparable results. Hydration status, exercise the day before, and meals significantly influence the result.
If you want to measure your body fat percentage and monitor it long-term, a combination of regular BIA measurements and occasional DEXA checks is useful. This way, you recognize trends before they become a problem.
| Method | Accuracy | Effort | Cost |
|---|---|---|---|
| BMI | Low | Very low | Free |
| BIA | Medium | Low | Low |
| DEXA | High | Medium | Medium to high |
| Skinfold | Medium | Medium | Low |
Basal Metabolic Rate and Calorie Needs: What Your Body Truly Consumes
In addition to body composition, individual calorie expenditure also influences the evaluation of all health metrics. Those who do not know their basal metabolic rate often grope in the dark when it comes to dietary changes.
The Basal Metabolic Rate (BMR) describes the amount of energy the body consumes at complete rest, i.e., for heartbeat, breathing, body temperature, and cell renewal. For most people, it accounts for 60 to 75% of the total calorie expenditure. The performance metabolism is added through physical activity and together results in the total energy requirement.
What many do not know: Two people with the same weight and height can have a basal metabolic rate that differs by up to 300 kilocalories per day. This is due to differences in muscle mass, thyroid function, genetics, and hormone balance. This explains why standard formulas such as the Harris-Benedict formula or the Mifflin-St.-Jeor formula, while useful, are often inaccurate.
How the basal metabolic rate is determined:
- Formulas (e.g., Mifflin-St.-Jeor): Quick and free, but based on average values. Suitable as a rough guide.
- BIA measurement: Estimates BMR based on body composition. More accurate than formulas, but still an estimate.
- Indirect calorimetry (Spiroergometry): Measures actual oxygen consumption and CO2 output. Most accurate for BMR, but complex and only available in specialized facilities.
- DNA analysis: Provides insights into genetically determined metabolic peculiarities that formulas cannot capture.
Pro Tip: If you have a specific weight goal, a precise basal metabolic rate measurement is worthwhile. Many fail at diets because they misjudge their needs and either eat too little (muscle breakdown) or too much (no progress). With a calorie needs calculator, you can calculate your individual needs as a starting point.
The basal metabolic rate becomes particularly relevant in the context of hormones. Thyroid hormones (T3, T4) directly regulate metabolism. A slightly underactive thyroid value that is still within the normal range can nevertheless lead to someone barely losing weight despite a calorie deficit. This is not a willpower problem, but biology.
Nutrient Profiles and Healthy Eating: Limit Values and Optimization
In addition to individual numbers, health always requires the right diet. But what does "right" specifically mean when you know your own values?
The EU and the Federal Institute for Risk Assessment (BfR) have developed nutrient profiles that serve as a guide for healthy food choices. These profiles define upper limits for fat, saturated fatty acids, sugar, and salt, as well as lower limits for fiber.
Practical guidelines for adults per day:
- Total fat: Maximum 70 g (of which saturated fatty acids under 20 g)
- Sugar (free added): Under 50 g, ideally under 25 g according to WHO recommendations
- Salt: Under 6 g daily
- Fiber: At least 30 g, most Germans only reach about 18 g
- Protein: 0.8 g per kilogram of body weight as a minimum, higher with physical activity
These numbers sound abstract until you start reading food labels. A common breakfast cereal can already contain 20 g of sugar per serving, almost half of the recommended daily maximum. Anyone who wants to improve their blood sugar or cholesterol levels should start right here.
Personalized nutrient profiles go even further. If you know that you are genetically predisposed to elevated triglycerides, a low-fat diet with a focus on omega-3 fatty acids makes more sense than a general low-carb diet. If your ferritin level is low, your body needs more iron-rich foods such as legumes, red meat, or fortified cereals combined with vitamin C.
The macronutrients and health values are in direct interaction. More fiber demonstrably lowers LDL cholesterol and stabilizes blood sugar. Less sugar reduces inflammatory markers such as CRP. A personalized diet uses these connections specifically, instead of relying on general recommendations.
The BfR dietary guidelines also recommend making dietary changes gradually. Those who try to change everything at once fail more often. One strategy: a concrete adjustment each week, such as fewer sugary drinks in week one, more vegetables in week two.
Why Single Readings Don't Count and Personalization Will Be Standard in the Future
After years of working with health data, a clear pattern emerges: people who have their values measured once and then do nothing more hardly benefit. The real value comes from repetition and comparison.
Normal tables are a starting point, not a judgment. A CRP value of 4.8 mg/l is technically within the normal range, but if it was 1.2 mg/l three months ago, that is a signal. Laboratories are increasingly relying on trend analyses instead of single-value interpretation, because the trend reveals more than the momentary value.
Parameters such as vitamin D, ferritin, hsCRP, and HbA1c value trends are gaining importance because they provide early warning signs long before classic symptoms appear. Those who regularly measure and digitally document these values can specifically adjust their diet, exercise, and sleep. This is no longer future music, but already possible today with modern home tests. Personalization is becoming the standard because average values are simply not enough for individual health.
Test Your Health Metrics Easily and Individually
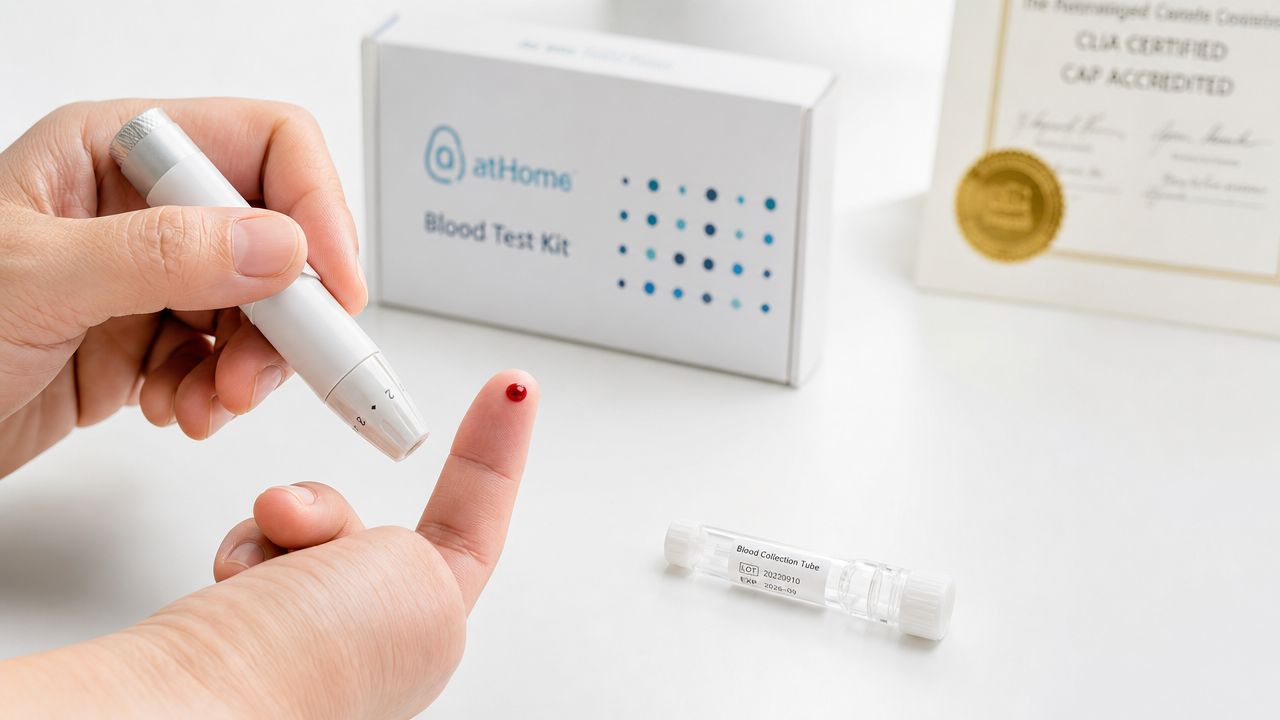
Once you know the theory, you can put it into practice. With mybody®, the most important health metrics can be conveniently analyzed from home, without a doctor's appointment and without long waits. The ISO-certified analyses cover blood values, DNA metabolism, micronutrients, hormones, and gut health. You receive a personalized report with concrete diet recommendations, lifestyle tips, and a clear action strategy. More than 11,300 customers with an average rating of 4.77 stars trust this approach. Start now with an individual health check and find out what your values really say about you.
Frequently Asked Questions About Health Metrics
Which blood values are particularly important for health prevention?
For prevention, cholesterol, blood sugar, liver and kidney values, and inflammation markers like CRP are central. The most important normal values help to detect deviations early and counteract them.
How often should you have your key health markers checked?
An annual screening of key markers such as HbA1c, vitamin D, and cholesterol is recommended from age 40. Younger individuals with risk factors or specific health goals should also test regularly.
Why is BMI not equally meaningful for everyone?
BMI does not consider fat distribution or muscle mass, overestimating risks in athletes and underestimating them in older individuals. Supplementary measurements such as BIA or waist-to-hip ratio provide a more accurate picture.
Which method is most accurate for determining body fat percentage?
DEXA measurement is the most accurate. In daily life, BIA scales are practical and trend-oriented, but they have an error margin of ±3 to 5% and should therefore always be used under the same conditions.


Share:
Immediate help: What to do in case of an allergic reaction?
Hormone Level Test Types: Which method is right for you?