

Blood sodium-potassium ratio: what the number does not show
The essentials at a glance
A blood sodium-potassium ratio is not an established metric. None of the sources reviewed from the WHO, DGE, EFSA, IQWiG, RKI, or the U.S. National Academies contains a target value or reference range for it. All evidence concerning the ratio relates to intake or urinary excretion.
The reason lies in physiology. The body keeps sodium and potassium in the blood within narrow limits, regardless of how much of them was on the plate. A ratio of two strictly regulated values varies little and says nothing about diet.
First, you will read what a sodium value actually indicates. Then come three common statements examined in a fact check, followed by blood regulation, intake figures for Germany, what the WHO actually recommends, why urine is the established method, and what a blood test can do here. The limitations come at the end.
What to expect in this article
1. What a blood sodium value actually indicates
2. Why a low value usually reflects water
3. Three statements about the ratio in the fact check
4. How closely the body regulates both values
5. Intake and recommendations in figures
6. What the WHO actually recommends
7. Why urine is the established method
8. What the evidence says about the ratio
9. Which method answers which question
10. What a blood test can do here
11. Limitations: what these values cannot answer
12. What matters about these values
Frequently asked questions
Sources
What a blood sodium value actually indicates
According to the Institute for Quality and Efficiency in Health Care, the reference range for blood sodium is 135 to 145 mmol/L for women and men over 18 (2025). For potassium, the same institute gives 3.7 to 5.1 mmol/L in serum and 3.5 to 4.6 mmol/L in plasma.
Dividing these two numbers gives a ratio of approximately 27 to 41. This range arises solely from the reference limits, not from differences in eating habits.
Key takeaway
A blood sodium-potassium ratio is not an established metric. It is calculated from two values that the body regulates closely and independently of dietary intake, so it does not provide information about intake.
What the sodium value measures instead
IQWiG explains the relationship as follows: the sodium level is closely linked to the body's water and salt balance—that is, how much water is taken in through food and drink and how much is excreted again through urine and sweat (2025).
The emphasis is on water. The value does not measure how much salt you have eaten, but the current relationship between sodium and water.
Why a low value usually reflects water
This distinction is so little known and has such far-reaching consequences that it provides the central quotation for this article.
Documented source
“A low sodium level is often not caused by a sodium deficiency, but by too much water in the body.”
Institute for Quality and Efficiency in Health Care (IQWiG)
Laboratory sodium level, as of 2025
In many cases, a low sodium level therefore does not mean that sodium is lacking, but that it has been diluted. Concluding from this that there is too little salt in the diet is the wrong conclusion.
The US National Academies of Sciences formulate the same observation as a general principle. In their report on reference values for sodium and potassium, they state that blood sodium concentration is not a reliable indicator of usual sodium intake because it usually reflects insufficient or excessive intake or loss of water (2019).
Three statements about the ratio in a fact check
Anyone researching the sodium-to-potassium ratio quickly comes across the following three statements. They are the reason this article was written in the first place.
Checked against the evidence
Commonly claimed
“The WHO recommends a sodium-to-potassium ratio of one to one.”
Documented
The WHO expressly states in its potassium guideline that its recommendations do not address the optimal sodium-to-potassium ratio (2012). One to one is a mathematical consequence of the two individual targets, not a target value.
Commonly claimed
“My blood test shows how much salt I eat.”
Documented
According to the National Academies report, blood sodium concentration is not a reliable indicator of usual intake (2019). It primarily reflects water balance.
Commonly claimed
“A normal potassium level proves adequate potassium intake.”
Documented
According to the same report, serum potassium concentration is maintained within a narrow range between 3.5 and 5.0 mmol/l across a wide range of potassium intake (2019).
The first point deserves an addition, because the number is not invented. The WHO writes that if both guidelines were followed, the molar ratio of sodium to potassium would be approximately one to one. This is a side note to the calculation and explicitly not a recommendation; it refers to the diet, not the blood.
How tightly the body maintains both values
The National Academies report describes potassium as being regulated in a way that remains stable across a wide range of intake: In healthy people with normal kidney function, the serum concentration is typically between 3.5 and 5.0 mmol/l (2019).
For sodium, a second rule applies. The same report notes that the body strictly regulates its water and sodium balance, but that when the two come into conflict, water and fluid balance take priority.
What this implies for the ratio
When both values are kept within narrow limits, their quotient also varies only within narrow limits. Calculating from the reference ranges gives a span of about 27 to 41, and this span describes not dietary patterns but the breadth of two normal ranges.
In other words, two people with completely different diets end up with nearly the same ratio in their blood, as long as both are healthy. That is precisely the purpose of regulation, and precisely why the quotient is not suitable as a dietary marker.
Why this regulation is so strict in the first place
Nerve and muscle cells work with the voltage difference between the inside of the cell and the surrounding fluid. Sodium and potassium essentially create this difference by being distributed unevenly: sodium predominates outside, potassium inside.
If this distribution shifts substantially, nerve signal transmission no longer works reliably. The body therefore has good reason to keep both concentrations constant, and it invests a considerable share of its energy consumption in doing so.
This has a double significance for a measured value. Because regulation works so well, a normal result says little about nutrition. And because it works so well, a significant deviation is all the more serious when it does occur.
The difference between blood and the inside of cells
Potassium adds a second layer. By far the largest share of potassium is inside the cells; only a small proportion is outside. A blood value measures precisely this small proportion.
Sodium is the opposite: It is the predominant ion outside the cells. The two values from which a quotient would be calculated therefore do not even describe the same body compartment in the same way. This also argues against using the quotient as a metric.
Intake and recommendation in figures
At the dietary level, the situation looks different. There are recommendations, measurements, and a demonstrable gap between the two. The following three figures use the same unit.
Sodium and potassium in figures
1,500 mg
1,500 mg of sodium per day is considered an estimated value for an appropriate intake for adults
4,000 mg
4,000 mg of potassium per day is considered an estimated value for an appropriate intake for adults
2,938 mg
Men consumed this much potassium per day in the National Nutrition Survey II; women consumed 2,526 mg
Source: German Nutrition Society (DGE), Reference Values for Sodium and Potassium (2016 derivation); intake data from the National Nutrition Survey II, Max Rubner Institute, 2013
The salt side of the calculation
In addition to the estimated value for sodium, the DGE provides a guideline of up to 6 grams of table salt per day (2023). The two figures do not contradict each other; they describe different things: one an appropriate intake, the other an upper limit.
Actual intake in Germany is higher. According to the biomarker-based analysis of the Robert Koch Institute’s German Health Interview and Examination Survey for Adults, median sodium intake was 4.0 grams per day for men and 3.4 grams for women, equivalent to 10.0 and 8.4 grams of salt (2016). The DGE notes that table-salt intake exceeds 6 grams per day for around 70 percent of women and 80 percent of men.
Why German figures contradict one another
Different methods produce different values. The food-consumption records from the National Nutrition Survey II show 2,766 milligrams of sodium for men and 1,932 for women, considerably less than the biomarker data.
The reason is well known: surveys barely capture the salt added during cooking and at the table. The same underreporting is likely to affect the potassium figures as well, which is why the gap relative to the estimated 4,000 milligrams should not be interpreted as an exact shortfall.
What the WHO actually recommends
In 2012, the World Health Organization published two separate guidelines, one on sodium and one on potassium. For sodium, it recommends that adults reduce their intake to below 2 grams per day, equivalent to 5 grams of salt, and classifies this recommendation as strong.
The WHO recommends two individual targets, not a ratio. The one-to-one ratio is a calculation.
The WHO recommends two individual targets, not a ratio. The one-to-one ratio is a calculation. For potassium, it suggests an intake of at least 90 millimoles per day, or 3,510 milligrams, and explicitly classifies this specific figure as a conditional recommendation.
A point that is often missing
In its January 2025 guideline on sodium-reduced salt substitutes, the WHO points to a safety concern. Such products contain potassium, and an excessively high potassium level in the blood can be harmful, especially when kidney function is impaired.
That is why this article does not recommend consuming more potassium or switching to potassium salt. Anyone taking diuretic medication, certain blood-pressure medicines, or living with kidney disease should discuss this question with a doctor.
Why urine is the established method
The report by the National Academies clearly identifies the method of choice: several carefully collected 24-hour urine samples with quality control are currently considered the best method for assessing long-term sodium and potassium intake (2019).
The physiological rationale is right next to it. Around 92.8 percent of the sodium consumed and approximately 77 percent of the potassium consumed are excreted in the urine. What goes in comes back out there, and that is precisely what makes urine a medium for measuring intake.
Spot urine also has limitations
According to the same report, a single spot urine sample is unlikely to be useful for estimating long-term intake, particularly at the individual level. The reasons are within-day and day-to-day fluctuations, as well as documented measurement biases.
This limitation also applies to the best German figure. The Robert Koch Institute's values are based on spot urine samples, not 24-hour urine collections. The Max Rubner Institute describes sodium excretion in 24-hour urine as the gold standard for determining daily salt intake (2016).
What the evidence says about the ratio
At the dietary level, the ratio does exist as a research measure. In 2025, Zwager and colleagues summarized 24 prospective cohort studies with a total of 1,356,473 participants. A higher estimated dietary sodium-to-potassium ratio was associated with a pooled hazard ratio of 1.10 for cardiovascular events and mortality.
The type of study is important. These are exclusively observational studies, and the authors accordingly describe their finding as an association, not a cause.
What randomized studies show
A 2022 Cochrane review by Brand and colleagues summarized randomized studies on reduced-sodium salt substitutes. Across more than 20 studies involving 21,414 participants, the mean reduction in systolic blood pressure was 4.76 millimeters of mercury, with moderate certainty of evidence.
These figures belong in the context of nutrition research, not alongside a test product. They are included here because a specialist article should present the evidence comprehensively, not as a promise.
Which approach answers which question
Three approaches provide information about sodium and potassium, and they answer fundamentally different questions. The table compares them according to the same four criteria.
| Criterion | Sodium and potassium in the blood | 24-hour urine collection | Dietary record |
|---|---|---|---|
| Answers the question | Is my current concentration within the reference range? | How high was my intake over the recorded period? | Where does the salt in my diet come from? |
| Reflects intake | No. Both values are tightly regulated independently of this | Yes, it is considered the best method for assessing long-term intake | Limited. Added salt is regularly underestimated |
| Effort required | A blood sample | Complete urine collection over 24 hours, repeated several times for reliable findings | Several days of consistently maintained records |
| What the value is useful for | Identifying a shift in water and electrolyte balance | Scientific and medical assessment of intake | Identifying your own sources of salt in everyday life |
The second line answers the initial question of this article. Anyone who wants to know how they eat is looking in the wrong place with a blood test, regardless of who offers it.
What a blood test can do here
A blood test answers a different question from the one about diet, and that question is not unimportant. It shows whether the current concentrations are within the expected range, and it shows them in relation to the other electrolytes.
As part of the mybody®x (MYBODY Lab GmbH) product range, BalanceCheck measures sodium and potassium together with calcium, magnesium, and phosphorus. What it cannot do is stated on the product card, and based on everything above, it is no surprise.
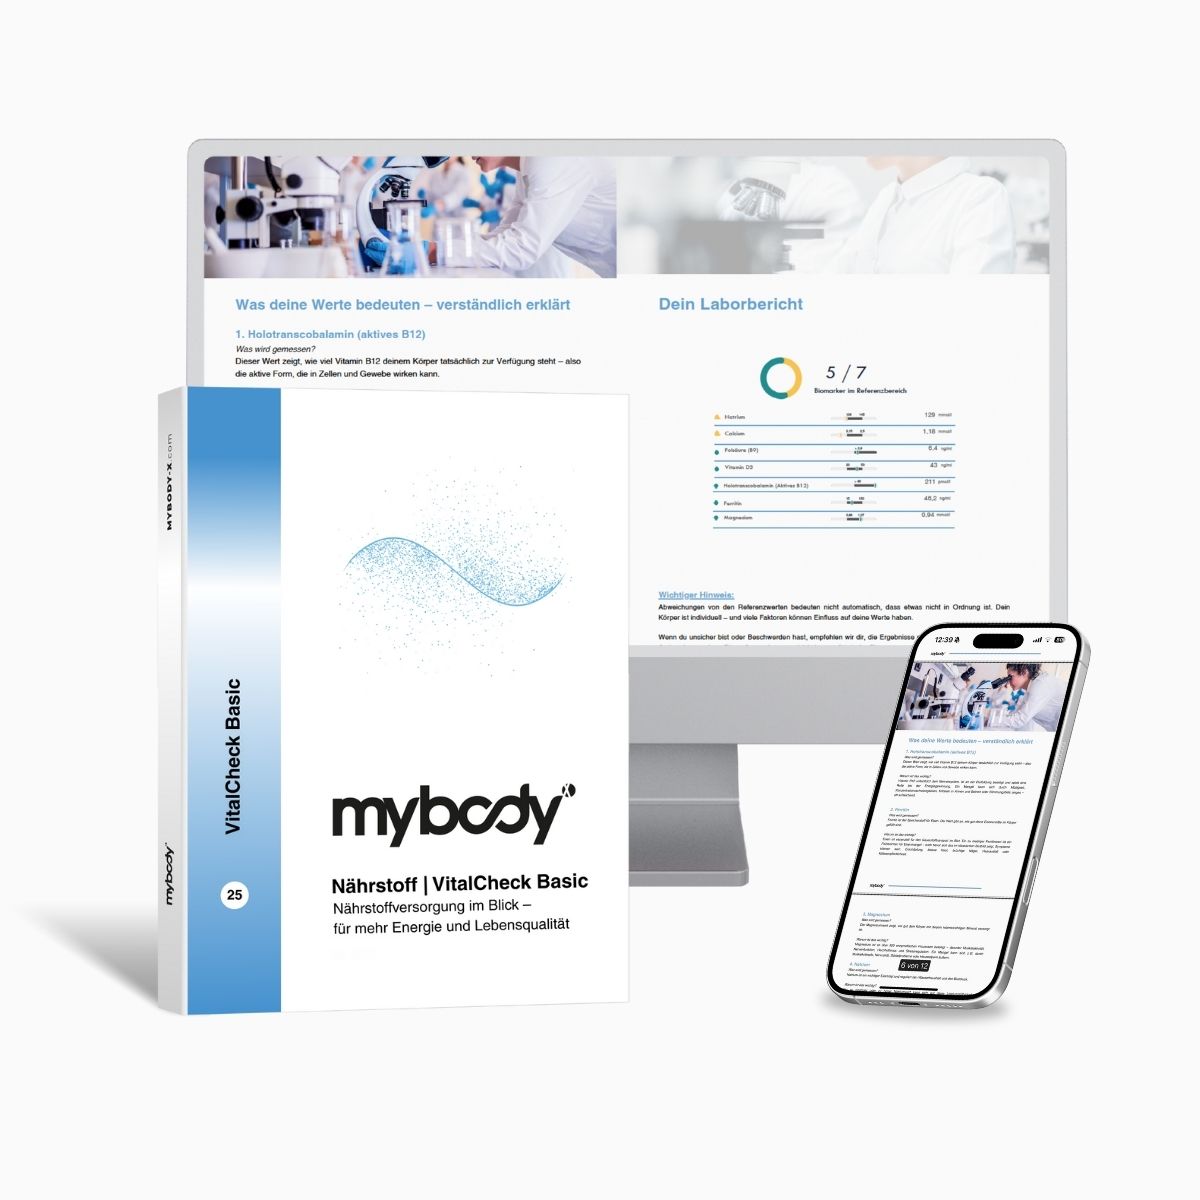
Blood test from capillary blood
BalanceCheck | Electrolytes & Minerals Test
15 elements from one blood sample: sodium and potassium together with calcium, magnesium, and phosphorus, plus six trace elements and four heavy metals. What the test does not do: It says nothing about your salt or potassium intake, because both values are tightly regulated in the blood independently of diet. It does not provide a sodium-to-potassium ratio as a metric because there is no established reference value for it. It does not provide a diagnosis.
Laboratory evaluation 3–5 business days after sample receipt
Product page information, accessed 10 August 2026
If you want to assess your intake, four steps will point you in the right direction, and none of them requires a laboratory.
Count processed foods
Bread, sausages, cheese, ready meals. That is where most of the salt is found, not in the salt shaker.
Read nutrition labels
The figure is usually given as salt, not sodium. One gram of salt corresponds to 400 milligrams of sodium.
Keep an eye on potassium sources
Vegetables, potatoes, legumes, fruit. Your potassium intake can be changed through what you put on your plate.
Clarify medication use with a doctor
Potassium-sparing medications, ACE inhibitors, sartans, impaired kidney function. Do not experiment on your own here.
Chapter at a glance
A blood test shows whether sodium and potassium are currently within the reference range, and it shows them in conjunction with the other electrolytes. It does not show how much salt or potassium someone consumes, because both values are tightly regulated independently of diet. Anyone wanting to assess their intake will learn more from processed foods and nutrition labels than from a blood sample. With certain medications and impaired kidney function, questions about potassium belong in the hands of a doctor.
Limitations: what these values cannot answer
A blood test does not establish a diagnosis. Abnormal sodium or potassium values require medical evaluation, together with fluid balance, kidney function, and medication.
It is not a dietary marker. That is the core message of this article and also the reason we addressed the topic at all: The search query that led to this text assumes a metric that does not exist in this form.
Interpreting a ratio is also tricky. Potassium is assessed differently depending on the sample material: IQWiG gives 3.7 to 5.1 mmol/L for serum and 3.5 to 4.6 mmol/L for plasma. Anyone dividing two values without knowing the material is calculating with different standards.
The data on intake also have limitations. The best German survey is based on spot urine rather than 24-hour urine collection, which the National Academies’ report explicitly describes as a weakness. Dietary records, in turn, underestimate added salt.
Finally, there is a boundary that this article itself draws. The studies on blood pressure and cardiovascular risk are included here to contextualize the state of research. They do not say what a measurement or product would cause, and they are explicitly not used that way here.
What matters about these values
If you take away one action from this article, let it be this: For three consecutive days, look at the salt content of the foods you already eat and add it up. It takes just a few minutes a day.
The reason is unremarkable. This figure is closer to your actual intake than any blood value, costs nothing, and immediately shows which foods provide the largest share. One gram of salt corresponds to 400 milligrams of sodium.
It all started with the question of the sodium-to-potassium ratio in the blood. The most honest answer is: This metric does not exist, and anyone selling it to you is selling you a calculation without a benchmark. What does exist is a nutrition facts table on every package.
Frequently asked questions
Is there an optimal sodium-to-potassium ratio in the blood?
The WHO, DGE, EFSA, IQWiG, RKI, and the U.S. National Academies sources reviewed contain neither a target value nor a reference range for a serum sodium-to-potassium ratio. All evidence concerning the ratio relates to dietary intake or urinary excretion. Moreover, a ratio of two closely regulated blood values varies only within the reference ranges and says nothing about diet.
Does the WHO recommend a one-to-one ratio?
No. In its 2012 potassium guideline, the WHO explicitly states that its recommendations do not address the optimal sodium-to-potassium ratio. It merely adds that if both guidelines are followed, the molar ratio would be approximately one to one. This is the result of calculating two separate targets, not a recommendation, and it refers to the diet, not the blood.
What does a low blood sodium level mean?
Not necessarily too little salt. IQWiG notes that this often is not due to a sodium deficiency, but to too much water in the body (2025). The reference range for adults is 135 to 145 mmol/l. An abnormal result should be medically evaluated together with fluid balance, kidney function, and medication.
How do you measure sodium and potassium intake correctly?
Through urine. The report by the National Academies identifies several carefully collected 24-hour urine samples as the currently best method for assessing long-term intake (2019). Around 92.8 percent of sodium and approximately 77 percent of potassium are excreted through urine. A single spot urine sample, by contrast, is of limited suitability for an individual, and a blood test does not reflect intake at all.
How much salt do people in Germany consume?
According to the biomarker-based analysis by the Robert Koch Institute, median sodium intake was 4.0 grams per day among men and 3.4 grams among women, equivalent to 10.0 and 8.4 grams of salt (2016). The DGE gives a reference value of up to 6 grams of table salt per day and notes that around 70 percent of women and 80 percent of men exceed it. Dietary records produce lower figures because they barely capture added salt.
Next step
Five electrolytes from one sample
If you want to know the current levels of sodium, potassium, calcium, magnesium, and phosphorus, the BalanceCheck measures them together. These values do not indicate your salt or potassium intake, and the test does not replace medical evaluation.
Go to the BalanceCheck How much sodium per dayRead more
You might also be interested in
The intake side of the topic, if you’re more interested in amounts than measurements.
How to interpret electrolyte laboratory values, value by value.
Sources
- Institute for Quality and Efficiency in Health Care (IQWiG): Sodium and potassium (as of 2025) – gesundheitsinformation.de
- World Health Organization (WHO): Guideline Potassium intake for adults and children and Guideline Sodium intake for adults and children, 2012 – ncbi.nlm.nih.gov
- National Academies of Sciences, Engineering, and Medicine: Dietary Reference Intakes for Sodium and Potassium, 2019 – ncbi.nlm.nih.gov
- German Nutrition Society (DGE): Reference values for sodium and potassium (derivation 2016) and questions and answers on table salt (as of 2023) – dge.de
The verbatim quotation regarding the low sodium level, the reference ranges for sodium and potassium, and the connection with fluid balance are taken from source [1]. The statement that the WHO does not recommend a ratio, as well as the recommended sodium and potassium intakes, are based on [2], supplemented by the WHO guideline on reduced-sodium salt substitutes from 2025. The statements on regulation in the blood, the unsuitability of the blood value as a marker of intake, 24-hour urine collection, excretion proportions, and spot urine samples are taken from [3]; estimates and the guidance value for table salt are from [4]. The biomarker-based intake figures come from the Robert Koch Institute’s Journal of Health Monitoring 2/2016; the food consumption record data and the note on the gold standard come from publications by the Max Rubner Institute from 2013 and 2016; both are attributed in the text with the institution and year. The meta-analysis by Zwager and colleagues (2025) and the Cochrane review by Brand and colleagues (2022) are attributed in the text with the authorship, journal, and year. Information on price, biomarkers, sample type, and laboratory comes from the mybody®x product page, accessed on 10.08.2026; processing times follow the central specification for blood tests. All sources were accessed and reviewed on 10.08.2026.

mybody®x editorial & expert team
Laboratory diagnostics Nutritional science Blood analysis interpretation Nutrigenetics
This article was created by the mybody®x editorial and expert team. The team combines laboratory diagnostics, nutritional science, and the interpretation of blood analyses. Anyone involved can be found on the authors page.
Published on 10.08.2026 · Last updated on 10.08.2026
The content is intended for general information and does not replace medical advice, diagnosis, or treatment. Reference ranges depend on the laboratory, method, and age—always refer to the information on your test report.



Share now:
Which weight-loss method is right for me? Eight approaches and the evidence behind them
How the Body Regulates Electrolytes: Kidneys, Hormones, and Numbers