

HbA1c: the period represented by the value
The essentials at a glance
HbA1c is the only commonly used blood glucose value that does not describe a point in time. The MSD Manual, professional edition, puts it succinctly: HbA1c levels reflect glucose control over the past three months (as of December 2025).
This gives the value its practical peculiarity. It cannot be influenced on the day of measurement, and it responds to a change in daily life only with a delay.
You will first read how the value forms. This is followed by a comparison of the diagnostic criteria, the period documented, the threshold figures, interfering factors, who can benefit from a measurement, and the limitations of an average.
What to expect in this article
1. How the value forms in the first place
2. Why there are three methods side by side
3. The diagnostic criteria compared
4. What exactly three months means
5. The sentence that explains the value
6. Not all weeks count equally
7. The thresholds in numbers
8. When the value is misleading
9. Who can benefit from the measurement
10. What a capillary blood test can show here
11. Limitations: what an average conceals
12. What matters about HbA1c
Frequently asked questions
Sources
How the value forms in the first place
HbA1c is not a blood glucose value in the strict sense. It is a protein value, and that is precisely what makes it distinctive.
Hemoglobin is the red blood pigment that transports oxygen. When glucose circulates in the blood, it attaches to this protein. The technical term for this is glycated hemoglobin, and the test measures its amount.
What matters is that this attachment remains. It does not come off again when blood glucose falls, and it disappears only when the red blood cell itself does.
That is why the value is a memory
Red blood cells live for several months. During that time, they accumulate whatever glucose passes by and retain that record.
The blood glucose reading from a finger prick, by contrast, describes precisely this moment. It changes within minutes and says nothing about yesterday.
The two values answer different questions. One asks what things look like now; the other asks what they looked like on average over the past few months.
Why the name comes with two units
On test results, this value appears in two notations. The older one gives it as a percentage, while the newer one uses millimoles per mole, and both are often shown side by side.
The percentage indicates the proportion of glycated hemoglobin in total hemoglobin. The second figure expresses the same ratio in a unit of amount of substance.
When comparing two results, this means: Check the unit first, then the number. A value of 5.7 and a value of 39 can describe the same condition, and an uncareful comparison can lead you astray.
The MSD Manual lists both values in parallel in its criteria (as of December 2025). That is precisely why they are also presented together throughout this article.
Why three methods are used side by side
In diagnostics, three methods are used side by side, and each has its own focus.
Fasting plasma glucose measures a point in time under defined conditions. The oral glucose tolerance test measures how the body responds to a specified amount of sugar. And HbA1c measures an average.
None of the three completely replaces the others. The MSD Manual, Professional Edition, therefore lists them in the same table, each with its own thresholds (as of December 2025).
Diagnostic criteria compared
The table reproduces the criteria from the MSD Manual, Professional Edition (as of December 2025). It provides an assessment and does not constitute a diagnosis.
| Method | Normal | Impaired glucose metabolism | Diabetes |
|---|---|---|---|
| Fasting plasma glucose | below 100 mg/dl, corresponding to below 5.6 mmol/l | 100 to 125 mg/dl, corresponding to 5.6 to 6.9 mmol/l | at least 126 mg/dl, corresponding to at least 7.0 mmol/l |
| Oral glucose tolerance test, two-hour value | below 140 mg/dl, corresponding to below 7.7 mmol/l | 140 to 199 mg/dl, corresponding to 7.7 to 11.0 mmol/l | at least 200 mg/dl, corresponding to at least 11.1 mmol/l |
| Glycosylated hemoglobin (HbA1c) | below 5.7 percent, corresponding to below 39 mmol/mol | 5.7 to 6.4 percent, corresponding to 39 to 46 mmol/mol | at least 6.5 percent, corresponding to at least 48 mmol/mol |
| Random blood glucose | Not specified in the source | Not specified in the source | at least 200 mg/dl, corresponding to at least 11.1 mmol/l |
The third column is particularly noteworthy. Between normal and diabetes, all three methods have a separate range, and this range has its own name.
The sister article Recognizing prediabetes: which values matter explains what this intermediate range means. This article focuses on the period reflected by HbA1c.
What exactly three months means
The reference to three months is not a rule of thumb, but follows from the lifespan of red blood cells. It determines how far back this value’s memory reaches.
This leads to two practical consequences, and both are regularly overlooked.
The first concerns the day of measurement. An especially frugal breakfast or abstaining the day before practically does not change the result. The value cannot be artificially improved in the short term.
The second concerns patience. Anyone who changes something about their daily routine will only see it reflected in HbA1c after several weeks. A check after two weeks essentially still shows the preceding period.
What this means for planning
The inertia of this value is an advantage in everyday life, but is usually experienced as a disadvantage. Anyone who has started making a change wants to see it confirmed, and the value does not provide that confirmation on demand.
The advantage becomes apparent when comparing two measurements. Because individual days have little influence, a difference between two values is harder to attribute to chance than a point-in-time measurement.
In practical terms, this means that anyone who wants to see the effect of a change should measure not after four weeks, but after three months. Everything before that mainly describes the baseline.
And anyone who wants to establish a baseline is best advised to do so before making the change. This point cannot be measured retrospectively.
The sentence that explains the value
The medical literature sums up the distinctive nature of this value in half a sentence.
Documented source
“HbA1c levels reflect glucose control over the past 3 months”
Erika F. Brutsaert, MD
MSD Manual, professional edition, Diabetes Mellitus, as of December 2025
Two words in this sentence deserve attention. One is reflect, and the other is control.
To reflect means that the value represents something; it does not measure it directly. And control here does not mean self-discipline, but the state of blood sugar regulation over time.
Not all weeks count equally
One point is almost always left out when discussing this value, and it explains many surprising results.
On the day of the test, nothing can be changed about this value anymore. That is both its strength and its price.
The red blood cells in the blood are of different ages. Some are fresh, while others are close to being broken down, and the average arises from this mixture.
This means that the more recent past has a greater influence on the result than the more distant past. The value is a weighted average, not an even one.
In practical terms, this means that a change becomes apparent before three full months have passed, but not immediately either. For monitoring changes over time, an interval of about three months is therefore the usual schedule. In type 1 diabetes, HbA1c should be measured quarterly (MSD Manual, professional edition, as of December 2025).
The thresholds in numbers
Three values from the same source, all in percent.
Established HbA1c thresholds
below 5.7
Percent: classified as normal, corresponding to below 39 mmol/mol (MSD Manual, professional edition, as of December 2025)
5,7–6,4
Percent: impaired glucose metabolism, corresponding to 39 to 46 mmol/mol (as of December 2025)
6.5 or higher
Percent: criterion for diabetes, corresponding to 48 mmol/mol or higher (as of December 2025)
What stands out is how narrow the middle range is. There is less than one percentage point between normal and the diabetes criterion, and the entire intermediate range fits within this narrow span.
Two units are commonly used: percent and millimoles per mole. They describe the same thing and look completely different, which is why comparing two results starts with looking at the unit.
And as with any laboratory value, the decisive factor is the reference range stated on your own report, because reference values may vary from one laboratory to another (IQWiG, as of April 2, 2025).
When the value is misleading
Because HbA1c is linked to red blood cells, anything that changes their lifespan shifts the value. The medical literature identifies both directions.
Values measured too high
Falsely high HbA1c values can occur with low red blood cell turnover, as well as with high doses of acetylsalicylic acid and high blood alcohol levels (MSD Manual, professional edition, as of December 2025).
Erythrocytes are red blood cells. Low turnover means they remain in the blood longer and collect glucose for longer, without the blood sugar having been higher.
Values measured too low
Falsely normal HbA1c values occur when red blood cell turnover is increased, as in hemolytic anemias and hemoglobinopathies (as of December 2025). Pregnancy also falsely lowers the HbA1c value.
The term falsely normal is the more dangerous of the two. A result can look unremarkable even though blood sugar regulation is not.
Why a second method can help
This is exactly why the medical literature presents three methods side by side rather than declaring one of them the standard.
All factors that interfere with HbA1c are related to red blood cells. Fasting plasma glucose and the glucose tolerance test, by contrast, measure the sugar in the blood directly and are independent of the lifespan of the blood cells.
So if one of the circumstances on the list applies, a second method is the obvious complement. Which one and when to use it is decided by a medical practice.
When reading your result, this means: An unremarkable HbA1c in someone with known anemia is not an all-clear, but a reason to discuss it with a healthcare professional. No self-test can provide this interpretation.
This leads to a practical rule for the report accompanying the results. Known anemia, a hemoglobinopathy, pregnancy, and regularly taken medications should be noted because they change how the result is interpreted.
Who may benefit from the test
HbA1c is a test with a clearly defined purpose. The comparison makes that clear in both directions.
Useful for you if …
You want to know what blood sugar regulation looked like on average over the past few months.
You want to establish a dated baseline against which something can be compared in three to six months.
You have changed something in your daily routine and want to see the effect after several months.
You want to bring numbers to a conversation at the practice rather than having them collected at your first appointment.
Probably not if …
If you want to know what your blood sugar level is right now, this value is not designed for that.
Du eine Veränderung der letzten zwei Wochen abbilden willst. Der Wert zeigt dann überwiegend die Zeit davor.
You want to reflect a change from the past two weeks. The value predominantly reflects the period before that.
You have anemia, a hemoglobinopathy, or are pregnant. In that case, interpretation is limited.
You are hoping for a diagnosis. That is provided by a medical practice, not a self-test.
What a capillary blood test can show here
A capillary blood self-test does not constitute a diagnosis and cannot determine whether diabetes is present. For HbA1c, however, it has an advantage over many other values: because it describes an average, the timing of the sample does not matter.
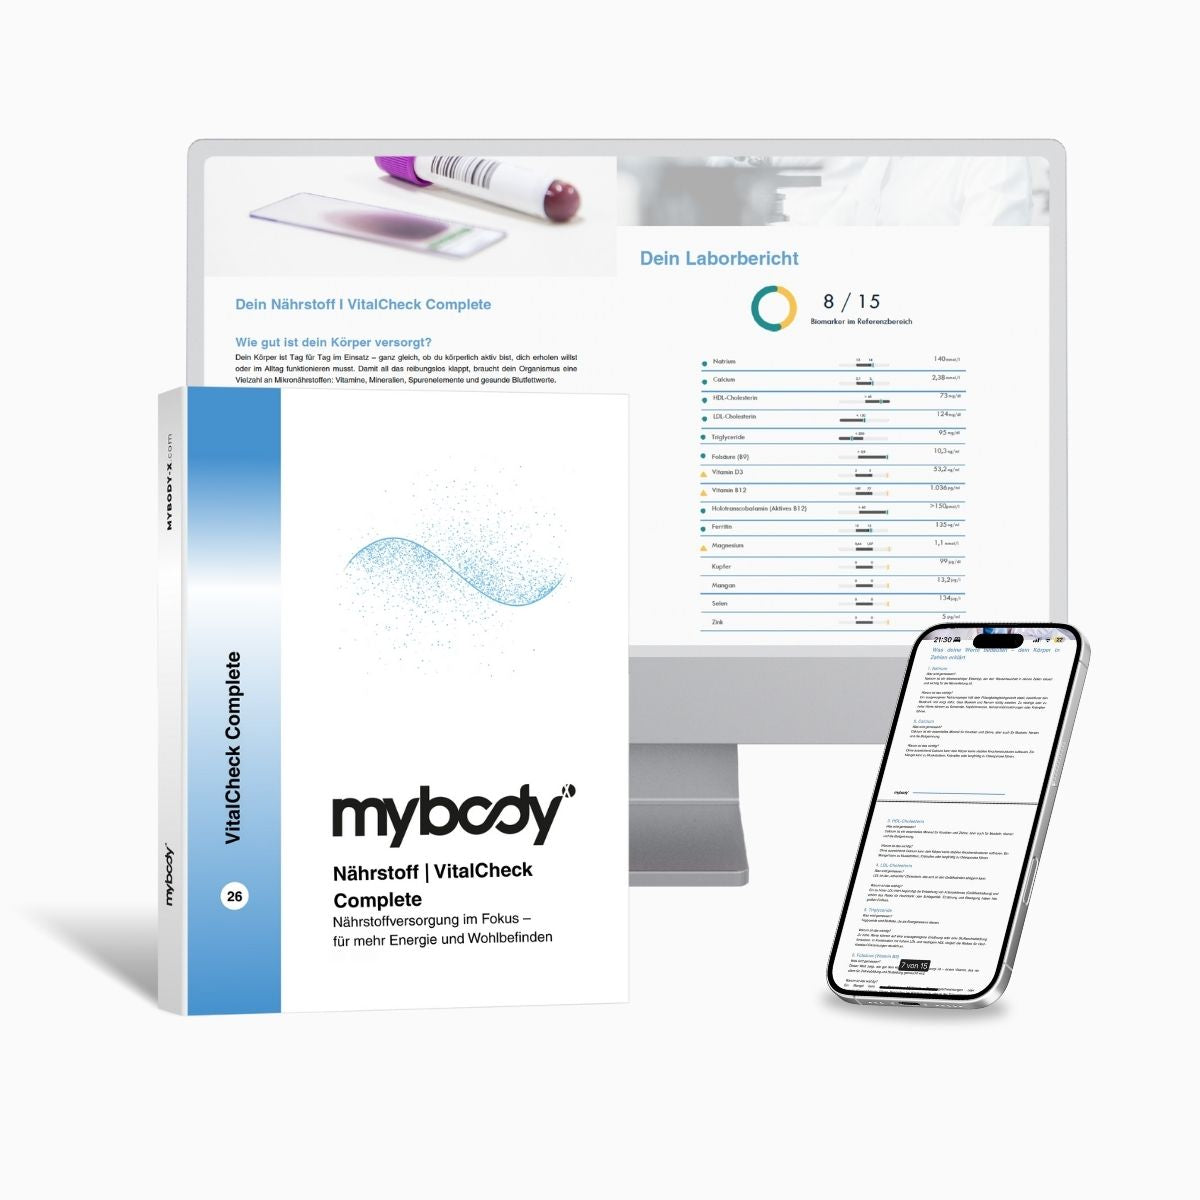
VitalCheck | Nutrient & Mineral Test Complete from mybody®x (MYBODY Lab GmbH)
Capillary blood test | VitalCheck
Nutrient & Mineral Test Complete
Kit shipping 1–3 business days
Certified medical laboratory
Product page information, accessed 13 August 2026
Point 1
Timing is irrelevant
Note confounding factors
Anemia, hemoglobinopathy, pregnancy, and medications change how the result should be interpreted.
Check the unit
Percent and millimoles per mole describe the same thing and look completely different.
Allow sufficient time between tests
For monitoring trends, about three months is the usual interval.
Chapter at a glance
A capillary blood self-test provides HbA1c as an average value over several months and does not constitute a diagnosis. Its advantage for this value is that the timing of the sample does not matter. Four points are crucial: timing is irrelevant, note confounding factors, check the unit, and allow sufficient time between tests.
Limitations: what an average conceals
The first limitation lies in the nature of an average. Two people with the same HbA1c can have very different histories, one with a steady course and the other with sharp fluctuations.
The second limitation is interfering factors. Falsely high values occur with a low erythrocyte turnover, falsely normal values with an increased turnover, and pregnancy falsely lowers the value (MSD Manual, professional edition, as of December 2025).
The third limitation is its sluggishness. The value does not answer the question of today, and it only provides a limited answer to the question of the past two weeks.
The fourth limitation concerns diagnosis. The criteria in the table provide context and do not constitute a diagnosis. A diagnosis is made in a medical practice based on several factors, and no self-test can anticipate it.
What matters about HbA1c
If you take away just one thing from this article, let it be this: HbA1c does not describe a single day, but a period of about three months.
This leads to both its usefulness and the need for patience. The value cannot be improved artificially on the day of the test, and a change in everyday life only becomes apparent in it after several weeks.
The initial question was what period the value reflects. The answer is stated verbatim in the professional literature: glucose control over the past three months. What it leaves out, however, are the fluctuations within that period.
Frequently asked questions
What period does the HbA1c value reflect?
About three months. The MSD Manual, professional edition, puts it this way: HbA1c levels reflect glucose control over the past three months (as of December 2025). The reason is the lifespan of red blood cells, whose pigment glucose attaches to and remains there.
Do I need to fast for the HbA1c test?
The timing of the sample does not matter for the value itself because it describes an average over several months. Unlike fasting plasma glucose, nothing can be influenced on the day of the test. If HbA1c is measured together with other values, the requirements depend on the complete order and are stated in the instructions for the respective test.
At what level is diabetes diagnosed?
The MSD Manual defines an HbA1c of 6.5 percent or higher, corresponding to 48 mmol/mol or higher, as a criterion. A range of 5.7 to 6.4 percent is considered impaired glucose metabolism, while below 5.7 percent is considered normal (as of December 2025). These criteria provide context; a medical practice makes the diagnosis, and the reference range on your own test result remains decisive.
When can the value be inaccurate?
Falsely high HbA1c values can occur with a low erythrocyte turnover, as well as with high doses of acetylsalicylic acid and high blood alcohol levels. Falsely normal values occur with an increased erythrocyte turnover, for example in hemolytic anemias and hemoglobinopathies, and pregnancy falsely lowers the value (MSD Manual, as of December 2025). Such circumstances should be noted alongside the test result.
How quickly does the value change?
Slowly. Because red blood cells vary in age, the more recent past has a greater influence than the more distant past, so a change becomes apparent before three full months have passed. For monitoring trends, an interval of approximately three months is the usual schedule; for type 1 diabetes, HbA1c should be measured quarterly (MSD Manual, as of December 2025).
Next step
Set a baseline value with the date
Because the value describes a period of time, it only becomes useful when comparing two measurements. VitalCheck measures long-term blood sugar together with 17 other values from capillary blood. It does not provide a diagnosis and does not replace medical evaluation.
Go to VitalCheckRead more
You might also be interested in
The reference article on the causes of elevated values.
A second value that says little without the right benchmark for comparison.
Sources
- MSD Manual, Professional Edition: Diabetes Mellitus (DM), Brutsaert EF (as of December 2025) – msdmanuals.com
- MSD Manual, Professional Edition: Diagnostic Criteria for Diabetes Mellitus and Impaired Glucose Metabolism, Table (as of December 2025) – msdmanuals.com
- Institute for Quality and Efficiency in Health Care (IQWiG): Understanding Laboratory Values Correctly, as of April 2, 2025 – gesundheitsinformation.de
The verbatim quotation regarding the period of three months, the information on falsely high and falsely normal values—including acetylsalicylic acid, blood alcohol, hemolytic anemias, hemoglobinopathies, and pregnancy—as well as quarterly testing for type 1 diabetes are taken from source [1]. All thresholds for fasting plasma glucose, the oral glucose tolerance test, HbA1c, and random blood glucose are taken from [2]. The explanation of the reference range and the note about differences between laboratories are taken from [3]. Information on price, values, sample type, and laboratory comes from the mybody®x product page, accessed on August 13, 2026; processing times follow the central specifications for blood tests. All sources were accessed and reviewed on August 13, 2026.

mybody®x Editorial & Expert Team
Laboratory diagnostics Blood analysis interpretation Nutritional science Nutrigenetics
This article was created by the mybody®x editorial and expert team. The team combines laboratory diagnostics, nutritional science, and the interpretation of blood analyses. Those who contribute to it are listed on the authors’ page.
Published on August 13, 2026 · Last updated on August 13, 2026
The content is for general information only and does not replace medical advice, diagnosis, or treatment. Reference ranges depend on the laboratory, method, and age—the information on your report is always authoritative.




Share now:
Hormone levels and the right day of the cycle
Blood lipid levels: why only all four together provide a complete picture