

Blood lipid levels: why all four together are needed to provide a complete picture
The essentials at a glance
A report usually lists four numbers under blood lipids: total cholesterol, LDL, HDL, and triglycerides. They do not describe four levels of the same thing, but four different things.
IQWiG summarizes the consequence in one sentence: An elevated LDL level is one of several risk factors, and personal risk can be estimated only when all factors are considered together (as of March 20, 2025).
First, you will learn what lies behind the four terms. Then come three common statements put to the fact check, a fifth value that many reports do not provide, figures from the authoritative sources, the question of fasting, who may benefit from a measurement, and the limitations of a profile.
What to expect in this article
1. What the report lists under blood lipids
2. The sentence that frames everything else
3. LDL and HDL are not two types of cholesterol
4. Three statements about blood lipids put to the fact check
5. Non-HDL: the value that is often missing
6. The figures from the authoritative sources
7. Why a single value tells you little
8. What matters before the blood draw
9. Comparing the four values
10. What can shift the values
11. Who may benefit from a measurement
12. What a capillary blood test can show here
13. Limitations: what a profile does not answer
14. What matters about blood lipid levels
Frequently asked questions
Sources
What the report lists under blood lipids
When you open a laboratory report, you will usually find blood lipids listed together in a block. Four lines, four numbers, four reference ranges.
At first glance, it seems that these are four levels of the same thing. This is where most misunderstandings begin.
Cholesterol itself is a building material. IQWiG describes it this way: Cholesterol is a valuable building material for the body because it is an important component of cells (as of March 20, 2025). So it is not something the body wants to get rid of.
Triglycerides are something else. They are an energy store, a natural component of fats, and are largely obtained through food, although the body can also produce them itself (IQWiG, as of March 20, 2025).
Two substances, four numbers
This means that the report shows two different substances, not one. Cholesterol appears three times—once as a total and twice as a transport form—while triglycerides stand on their own.
That explains why the four numbers do not have to rise or fall together. They can change independently of one another, and that is precisely where the information lies.
So if you read only one of the four lines, you are not reading an abbreviated version of the report. You are reading a different report.
The sentence that frames everything else
Before discussing a single number, it is worth looking at the context IQWiG provides for the topic as a whole.
Documented source
“An elevated LDL cholesterol level is one of several risk factors—the personal risk of cardiovascular disease can be estimated only when all factors are considered together.”
Institute for Quality and Efficiency in Health Care
IQWiG, gesundheitsinformation.de, LDL cholesterol, as of 20 March 2025
Two parts of this sentence deserve attention. The first says that LDL is one of several factors. The second says that an assessment is possible only when all of them are considered together.
According to IQWiG, these additional factors include smoking, age, sex, and pre-existing conditions such as diabetes, high blood pressure, or impaired kidney function (as of 20 March 2025). None of them appears in the blood lipid panel.
One more sentence from the same source belongs here: A disease usually cannot be inferred from a single laboratory value alone (as of 20 March 2025). This applies particularly here because four numbers side by side create the illusion of completeness.
LDL and HDL are not two types of cholesterol
This is the second common misconception, and it runs deeper than the first.
LDL stands for low-density lipoprotein. HDL stands for high-density lipoprotein (IQWiG, as of 20 March 2025). Both terms describe a form of transport, not the substance being transported.
Cholesterol is not soluble in water and therefore needs a carrier to travel through the blood. These carriers differ in their density, which is what the two abbreviations refer to.
Where the two transport cholesterol
The direction is the real difference. LDL cholesterol accounts for more than two thirds of the cholesterol in the blood and is transported from the liver to the rest of the body (IQWiG, as of 20 March 2025).
With HDL, it works the other way around. About one quarter of the cholesterol in the blood is present as HDL cholesterol, and in this form, excess cholesterol is transported in the body to the liver, where it can be broken down (IQWiG, as of 20 March 2025).
Two thirds and one quarter still do not add up to the full total. The remainder is distributed among other transport forms, and this exact remainder will become important again later in this article.
The substance itself is the same in both cases. A cholesterol molecule does not become a different molecule simply because it is carried in a different carrier.
Three statements about blood lipids in a fact check
These three statements come up regularly. All three can be assessed against the sources reviewed.
Checked against the available evidence
Common belief
“HDL is the good cholesterol, and LDL is the bad cholesterol.”
Supported by evidence
Both are forms of transport for the same substance in different directions (IQWiG, as of March 20, 2025). None of the sources reviewed assigns them the labels good and bad. IQWiG is more cautious about HDL, writing that higher levels probably have a more favorable effect on the risk of cardiovascular disease.
Common belief
“Cholesterol mainly comes from food.”
Supported by evidence
IQWiG writes: Only about one-third of the body’s cholesterol requirement is obtained through food; the body produces most of it itself, especially in the liver (as of March 20, 2025). The larger share therefore originates in the body.
Common belief
“A good LDL level means that everything is fine.”
Supported by evidence
Personal risk can only be estimated when all factors are considered together (IQWiG, as of March 20, 2025). These factors include smoking, age, sex, and pre-existing conditions—and none of them appears in the blood lipid section.
The second point has a practical consequence that this article does not explore further. How quickly a cholesterol level changes is covered in the companion article How quickly cholesterol levels change.
Non-HDL: the value that is often missing
Earlier, a remainder was left over. Two-thirds LDL and one-quarter HDL do not make up all the cholesterol in the blood, and this remainder has a name of its own.
IQWiG describes the value as follows: Non-HDL cholesterol is total cholesterol without HDL cholesterol. It continues: This value is considered the best predictor of heart and vascular health because, in addition to LDL cholesterol, it includes the other harmful forms (as of August 6, 2025).
That is a remarkable statement. The value IQWiG calls the best predictor does not appear as a separate line on many test reports.
Why it is nevertheless included in every test report
It can be calculated from two existing figures. Anyone whose test report includes total cholesterol and HDL already has the value, even if it is not printed.
IQWiG adds that many risk calculators use it to determine personal cardiovascular risk (as of August 6, 2025). According to the same source, such calculators belong in a discussion with a medical practice, not in a self-assessment at the kitchen table.
For you, when reading a test report, this means above all one thing: The blood lipid panel is not fully assessed even when all four lines are within the reference range.
The figures from the key sources
Three figures, each with a source and date. They provide context and do not constitute a diagnosis.
Evidence-based classifications
below 200
mg/dl total cholesterol, equivalent to below 5.2 mmol/l: classified as optimal by IQWiG (as of August 6, 2025)
below 100
mg/dl LDL cholesterol, equivalent to below 2.6 mmol/l: classified as optimal by IQWiG (as of August 6, 2025)
below 150
mg/dl triglycerides, equivalent to below 1.7 mmol/l: reference range for adults aged 18 and over (IQWiG, as of March 20, 2025)
With HDL, the direction is reversed. A value below 40 mg/dl, equivalent to 1.0 mmol/l, is considered unfavorable (IQWiG, as of August 6, 2025).
The MSD Manual, professional edition, additionally differentiates HDL by sex and classifies a higher risk as being below 40 mg/dl in men and below 50 mg/dl in women (as of December 2025). Two sources, two approaches—and both should be mentioned rather than silently choosing one.
And as with every laboratory value, what matters is the reference range stated on your own test report, because reference values can vary from one laboratory to another (IQWiG, as of April 2, 2025).
Why a single value carries little weight
The preceding sections lead to an observation that can be summed up in one sentence.
Four figures side by side create an impression of completeness. They are the beginning of an assessment, not its conclusion.
The reason lies in the structure of the issue. Some of the key factors lie outside the laboratory, namely age, smoking, and pre-existing conditions (IQWiG, as of March 20, 2025).
In addition, the four values can move in different directions. Low total cholesterol with very low HDL describes a different situation from low total cholesterol with high HDL, even though the first line looks identical.
How a ratio can be formed from two of these figures and what it is useful for is covered in the companion article The LDL-to-HDL ratio: what it says.
What matters before the blood sample is taken
At this point, two sources are presented side by side that do not say the same thing. Both should be mentioned.
IQWiG's information
For triglycerides, IQWiG is unequivocal: It is important not to eat anything during the eight hours before the blood sample is taken and to drink only still water, because a meal can increase the level, especially if it contains a lot of fat or sugar (as of March 20, 2025).
For LDL cholesterol, the same source gives a considerably weaker statement. According to IQWiG, meals have little effect on this level (as of March 20, 2025).
The MSD Manual's statement
The MSD Manual, professional edition, puts it more narrowly: Most experts recommend fasting lipid measurements only in certain situations, such as when non-HDL cholesterol is above 220 mg/dL or triglycerides are above 400 mg/dL (as of December 2025).
The two statements do not completely contradict each other; they emphasize different points. One describes what a meal does to the triglyceride level, while the other explains when a fasting measurement is professionally required.
In practical terms, this means that the instructions for the particular test or the requirements of the practice requesting the sample are what matter. Anyone who decides for themselves is making that decision without knowing the instructions.
And if you want to compare two test results, the condition is part of the comparison. A fasting triglyceride measurement and a nonfasting one are two different measurements, even if both fill the same row.
The four levels compared
The table compares the four rows of the blood lipid section using the same four questions.
| Level | What it describes | Classification according to the source | What it does not say on its own |
|---|---|---|---|
| Total cholesterol | The total amount of cholesterol in the blood across all transport forms | below 200 mg/dL, corresponding to below 5.2 mmol/L, classified as optimal (IQWiG, as of August 6, 2025) | How the total is distributed among the transport forms |
| LDL cholesterol | More than two-thirds of the cholesterol in the blood, transported from the liver to the body | below 100 mg/dL, corresponding to below 2.6 mmol/L, classified as optimal (IQWiG, as of August 6, 2025) | The individual risk, because all factors count together |
| HDL cholesterol | About one quarter of the cholesterol, transporting excess cholesterol to the liver | below 40 mg/dL, corresponding to 1.0 mmol/L, classified as unfavorable (IQWiG, as of August 6, 2025) | Whether the overall picture is favorable—on its own, the level is not very informative according to IQWiG |
| Triglycerides | An energy store, not cholesterol; largely obtained through food | below 150 mg/dL, corresponding to below 1.7 mmol/L, for adults aged 18 and over (IQWiG, as of March 20, 2025) | Something about cholesterol, because it measures a different substance |
The last column is the actual message of this article. Each of the four rows has a gap, and the gap in one is filled by another row.
What can shift the levels
A blood lipid level does not arise in a vacuum. The specialist literature lists a number of circumstances that can change it without diet playing a role.
The MSD Manual, professional edition, lists common secondary causes of dyslipidemia, including diabetes mellitus, chronic kidney disease, cholestatic liver disease, and hypothyroidism, meaning an underactive thyroid (as of December 2025).
Medications are also included on this list. It names, among others, thiazides, beta blockers, retinoids, ciclosporin, tacrolimus, progestogens, and glucocorticoids (as of December 2025).
What this means for the result sheet
This list is not a reason to question your medication. Decisions about ongoing medication are made exclusively by the prescribing practice.
It is an occasion to mention your current medication when discussing a result. A value read without this information is interpreted incompletely.
The same source provides a separate list for HDL. Secondary causes of low HDL cholesterol listed there include tobacco use, anabolic steroids, HIV infection, and nephrotic syndrome (as of December 2025).
Who may benefit from testing
The comparison refers to the four-value lipid profile and says something in both directions.
It makes sense for you if …
You have never had your blood lipids fully measured and want to see all four numbers.
You have only known one individual value so far, for example from a device-based testing station, and the other three are missing.
You want to establish a dated baseline against which something can be compared later.
You want to bring numbers to an appointment at the practice instead of having them collected at your first visit.
Probably not if …
You hope to estimate your risk from four numbers. Age, smoking, and pre-existing conditions also count for that.
You want to review an existing treatment. That belongs in the practice that prescribed it.
You measured yourself just a few weeks ago. A second value shortly afterward describes almost the same period.
You expect a diagnosis. That is provided by a medical practice, not a self-test.
What a capillary blood test can show here
A capillary blood self-test does not diagnose or estimate cardiovascular risk. What it can do is provide all four lines of the blood lipid panel together, rather than just one of them individually.
Three tests from mybody®x (MYBODY Lab GmbH) provide the complete lipid profile: the VitalCheck, as well as the Men's and Women's Wellness Check. The VitalCheck is used here as a representative example because it includes the four values in the nutrient profile.
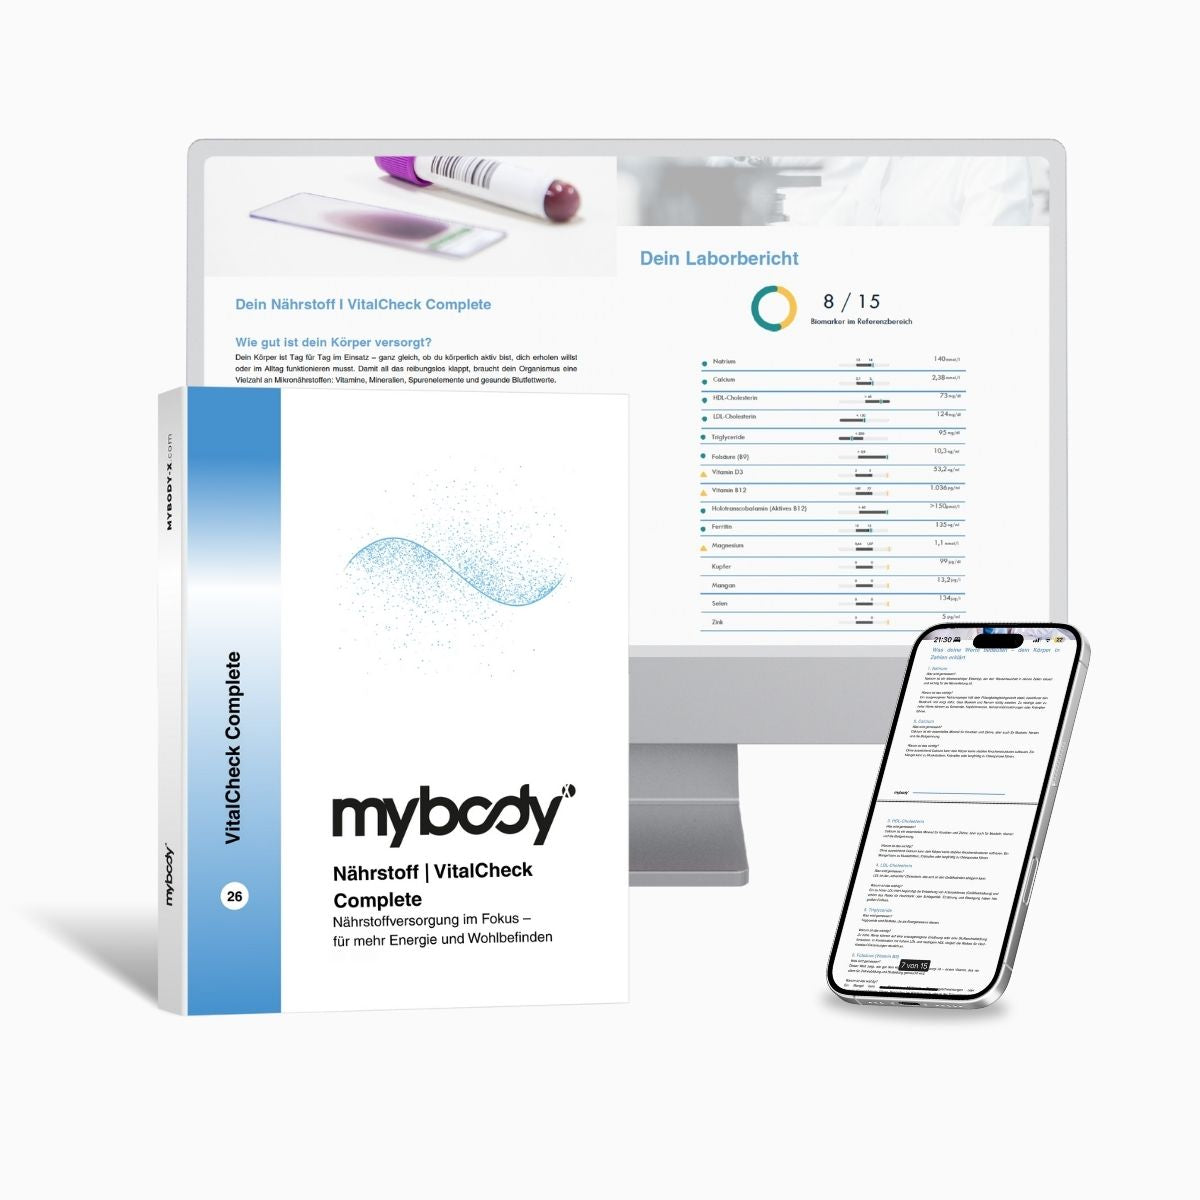
Capillary blood test
VitalCheck | Nutrient & Mineral Test Complete
Führt 18 Werte und darunter alle vier Blutfette: Gesamtcholesterin, HDL, LDL und Triglyceride. Dazu Ferritin, Eisen, Transferrin, Vitamin B12, Folsäure, Vitamin D, den Langzeitblutzucker, CRP, Albumin sowie Calcium, Magnesium, Phosphat, Selen und Zink. Was der Test nicht leistet: Er weist das Non-HDL-Cholesterin nicht als eigene Zeile aus, er schätzt kein Herz-Kreislauf-Risiko ein, stellt keine Diagnose und ersetzt keine ärztliche Untersuchung.
Kit shipping 1–3 business days
certified medical laboratory
Product page information, accessed 08/15/2026
Point 1
Read all four
Note the conditions
Whether you were fasting or not is part of the triglyceride value.
Mention any medication
Several groups of active ingredients measurably shift the values.
Discuss the interpretation
The other risk factors are not included in the laboratory report.
Chapter at a glance
A capillary blood self-test provides all four blood lipids together and does not constitute a diagnosis. Its value lies in the completeness of the panel, not in an evaluation. Four points are crucial: read all four, note the conditions, mention any medication, and discuss the interpretation.
Limitations: what a profile cannot answer
The first limitation is the most important. Four laboratory values do not provide a risk assessment because, according to IQWiG, all factors must be considered together, and several of them lie outside the laboratory (as of 03/20/2025).
The second limitation is the snapshot in time. The MSD Manual, professional edition, states that even in healthy people, total cholesterol levels can fluctuate by ten percent and triglycerides by up to 25 percent within 24 hours (as of December 2025).
The third limitation is the missing fifth value. Non-HDL cholesterol is not included in many reports, even though IQWiG describes it as the best predictor (as of 06/08/2025).
The fourth limitation is diagnosis. All the classifications in this article provide context and do not constitute a diagnosis. A diagnosis is made in a medical practice based on several components, and no self-test can anticipate it.
What matters when it comes to blood lipid levels
If you take away just one thing from this article, let it be this: The four lines in the blood lipid section do not describe one thing in four degrees, but two substances from four perspectives.
This follows from how to interpret them. A single line conveys no conclusion, and four lines together provide context, but not a risk assessment.
The starting point was the question of why these values belong together. The answer is in the table’s last column: Each value has a gap, and another value fills that gap.
Frequently asked questions
Which blood lipid values belong together?
Total cholesterol, LDL, HDL, and triglycerides. The first three describe the same substance from different perspectives: the total amount and two transport forms. Triglycerides measure a different substance, namely an energy store (IQWiG, as of March 20, 2025). Therefore, the four numbers do not necessarily move together.
Is HDL the good cholesterol and LDL the bad cholesterol?
This attribution appears in none of the sources reviewed. Both are transport forms of the same substance moving in different directions: LDL from the liver to the body, HDL from the body back to the liver (IQWiG, as of March 20, 2025). Regarding HDL, IQWiG cautiously states that higher levels are probably associated with a more favorable risk of cardiovascular disease.
Do I need to fast for blood lipid tests?
The sources emphasize different aspects. For triglycerides, IQWiG advises not eating anything and drinking only still water in the eight hours before blood is drawn because a meal can increase the value (as of March 20, 2025); meals have little effect on LDL. The MSD Manual recommends fasting measurements only in certain situations (as of December 2025). The instructions for the specific test are decisive.
What is non-HDL cholesterol?
Total cholesterol without HDL cholesterol. IQWiG describes this value as the best predictor of heart and vascular health because, in addition to LDL cholesterol, it includes the other harmful variants, and notes that many risk calculators use it (as of August 6, 2025). It is not listed as a separate line on many test reports.
Does a single cholesterol value tell me anything?
Only to a limited extent. IQWiG notes that a disease usually cannot be inferred from a single laboratory value alone, and that an elevated LDL level is one of several risk factors because personal risk can only be estimated by considering all factors together (as of March 20, 2025). These factors include smoking, age, sex, and pre-existing conditions.
Next step
See the whole panel instead of one line
Because each of the four numbers has its own gap, the blood lipid panel only delivers its full benefit when considered as a whole. VitalCheck measures total cholesterol, HDL, LDL, and triglycerides along with 14 other values from capillary blood. It does not provide a diagnosis and does not replace medical evaluation.
Go to VitalCheckRead more
You might also be interested in
The timeline: why there should be an interval between two measurements.
What a ratio indicates and which quotient appears in the sources.
Sources
- Institute for Quality and Efficiency in Health Care (IQWiG): LDL Cholesterol, as of 20 March 2025 – gesundheitsinformation.de
- IQWiG: HDL Cholesterol, as of 20 March 2025 – gesundheitsinformation.de
- IQWiG: Triglycerides, as of 20 March 2025 – gesundheitsinformation.de
- IQWiG: Cholesterol, as of 20 March 2025 – gesundheitsinformation.de
- IQWiG: Elevated Cholesterol Levels, as of 6 August 2025 – gesundheitsinformation.de
- IQWiG: Understanding Laboratory Values Correctly, as of 2 April 2025 – gesundheitsinformation.de
- MSD Manual, Professional Edition: Dyslipidemia, Davidson MH and Altenburg M (full review May 2025, last updated December 2025) – msdmanuals.com
The verbatim quotation regarding the multiple risk factors, the information about more than two-thirds of LDL, the direction of transport, and the limited significance of an individual value comes from source [1]. The information about HDL, the proportion of approximately one-quarter, and the cautious wording regarding beneficial effects comes from [2]. The definition of triglycerides, the reference range below 150 mg/dl, and the information about the eight hours before blood collection come from [3]. The information that only about one-third of the cholesterol requirement is obtained through food comes from [4]. The classifications for total cholesterol, LDL, and HDL, as well as the description of non-HDL cholesterol and the risk calculators, come from [5]. The explanation of the reference range comes from [6]. The sex-specific HDL classification, secondary causes, drug classes, and information about fluctuations within 24 hours and fasting measurements come from [7]. Information on price, values, sample type, and laboratory comes from the mybody®x product page, accessed on 15 August 2026; processing times follow the central specifications for blood tests. All sources were accessed and reviewed on 15 August 2026.

mybody®x Editorial & Expert Team
Laboratory diagnostics Blood analysis interpretation Nutritional science Nutrigenetics
This article was created by the mybody®x editorial and expert team. The team combines laboratory diagnostics, nutritional science, and the interpretation of blood analyses. Those who contribute to it are listed on the authors' page.
Published on 15 August 2026 · Last updated on 15 August 2026
The content is intended for general information and does not replace medical advice, diagnosis, or treatment. Reference ranges depend on the laboratory, method, and age; the information on your report is always authoritative.




Share now:
HbA1c: the period represented by the value
fT3 and fT4 alongside TSH: what they add