

Reference ranges are distributions, not target values
The key points at a glance
Every report has a range next to the number. Almost everyone reads it as a target. It is something else.
A reference range describes where the test results of many healthy people fall. Its limits are set so that 95 percent fall within it—and therefore 5 percent do not.
You will read three documented pieces of information, the cited source in full, four ranges compared, three common statements fact-checked, and what follows from this for a flagged report.
What to expect in this article
1. The range next to the number
2. Three documented pieces of information
3. How a reference range is established
4. The documented source
5. The five percent at the edges
6. Four ranges compared
7. What the width of a range reveals
8. The key point in one sentence
9. Where actual target values exist
10. Three statements fact-checked
11. What a flag on the report means
12. Who can put this knowledge into practice
13. What a test using capillary blood can show here
14. What the limits of a reference range leave open
15. What matters about the reference range
Frequently asked questions
Sources
The range next to the number
Every laboratory report follows the same structure. The name of the value is on the left, your own number in the middle, and a range on the right.
This range is almost always read as a target. Within it is good, outside it is bad, and the further inside, the better.
All three assumptions are wrong, for the same reason. A reference range is not a requirement but a description.
This article explains exactly what it describes, how its limits are established, and what follows from this for a flagged report. It does not provide target values or optimal ranges.
It is also the foundation for a sentence that appears in almost every other article on this blog: The decisive factor is the reference range on your own report. This article explains why that sentence appears there.
Three documented pieces of information
Three pieces of information from the reviewed sources. They provide context and do not constitute a diagnosis.
Documented information
95 %
of the test results of healthy people fall within the range—that is how its limits are set (IQWiG, as of April 2, 2025)
5 %
of people have results outside the reference range even though they are healthy (IQWiG, as of April 2, 2025)
9–140
µg/l is the ferritin reference range for women over 18—the upper value is more than fifteen times the lower value (IQWiG, as of March 20, 2025)
The third piece of information shows how little a reference range says about an individual person. Two healthy women can differ by a factor of fifteen for this value and both still be within the range.
And as with every laboratory value, the decisive factor is the reference range stated on your own report, because reference values can vary from one laboratory to another (IQWiG, as of April 2, 2025).
How a reference range is established
The method behind it is simple and immediately explains everything that follows.
A value is measured in many people who are considered healthy. This produces a distribution: Most values lie in the middle, while a few are far below and a few far above.
Then 2.5 percent is cut off at each end. What remains is 95 percent of the measurements, and the limits of this section are the reference range.
The range is therefore a statistical summary of a group. It says where the values of healthy people lie. It does not say where a particular person’s value should lie.
Who Belongs to This Group
A question naturally arises: Which healthy people are we actually talking about?
This is precisely why many reference ranges are reported separately by age and sex. For ferritin, IQWiG gives a different range for women over 18 than for men because the distributions differ (as of 03/20/2025).
This distinction is not necessary for other values. For transferrin and calcium, the same source gives the same range for women and men over 18.
When reading a test result, this means that the line next to it applies to a group that you may or may not belong to. For example, anyone significantly younger or older than the group from which a range was derived should interpret it with an additional reservation.
The Documented Source
The method is stated in one sentence from a public source, and one word in it carries the entire message.
Documented Source
“Reference ranges for a laboratory value are usually established based on measurements taken from many healthy people.”
Institute for Quality and Efficiency in Health Care
IQWiG, gesundheitsinformation.de, Understanding Laboratory Values Correctly, as of 02/04/2025
The crucial word is measurements. The range is formed from what was measured, not from what someone considers desirable.
The same source then describes how the limits are drawn: so that 95 percent lie within the range (as of 02/04/2025).
This establishes the entire logic. A reference range is a section of a distribution, and the distribution comes from people who were considered healthy.
The Five Percent at the Edges
The 95 percent rule leads directly to something that surprises many people.
IQWiG states it explicitly: 5 percent of people have results outside the reference range even though they are healthy (as of 02/04/2025). It also states that an abnormal value therefore does not necessarily need to be treated.
These five percent are neither measurement errors nor overlooked sick people. They are the ends of the same distribution from which the middle also comes. They inevitably arise as soon as you cut out a section of a distribution.
The same source gives an example in the other direction: An elevated urea level may indicate kidney disease or a particularly meat-rich diet (as of 2 April 2025). One number, two very different explanations.
Four ranges compared
The table compares four reference ranges from the articles on this blog. It provides context and is not a diagnosis.
| Value | Reference range | Ratio of upper to lower value | What this suggests |
|---|---|---|---|
| Calcium | 2.20–2.54 mmol/l, women and men over 18 (IQWiG, as of 20 March 2025) | Around 1.15-fold | Very tight regulation in the body |
| Magnesium | 0.70–1.05 mmol/l from age 18 (IQWiG, as of 20 March 2025) | Around 1.5-fold | Also narrow, with somewhat more leeway |
| Transferrin | 200–360 mg/dl, women and men over 18 (IQWiG, as of 20 March 2025) | Around 1.8-fold | Moderate range, the same for both sexes |
| Ferritin | 9–140 µg/l for women, 18–360 µg/l for men over 18 (IQWiG, as of 20 March 2025) | More than 15-fold or 20-fold | A very broad distribution—here, being within the range says little |
The four rows show the same principle in entirely different degrees. For the first, being within the range means something fairly specific; for the last, it means almost nothing. All four come from the same source and were created according to the same rule.
What the width of a range reveals
The table suggests a reading rule that is useful for every test result.
A narrow range points to a value that the body actively regulates. This is exactly what IQWiG describes for calcium: The blood level is very precisely regulated by various hormones (as of 20 March 2025). A regulated value varies little, so a deviation carries corresponding weight.
A broad range points to a value that varies greatly among healthy people. This is the case with ferritin, so merely being within the range says less there than elsewhere.
This rule is a guideline, not a diagnostic tool. It helps put into perspective how much a marker can mean at all, but it does not answer what it means in an individual case.
It is particularly useful when first looking at a new result. Comparing the widths of the ranges immediately shows which rows are tightly defined and which leave plenty of room.
This also helps put one’s own attention into perspective. A slight exceedance in a very narrow range is different from the same slight exceedance in a range whose upper value is fifteen times the lower one.
The core in one sentence
At this point, the topic can be summed up.
The range describes where other people’s values lie. It does not tell you where yours should lie.
This distinction also means that the middle of the range is no better a place than the edge. The middle is where most values lie, and that is all it tells you.
Anyone who wants to move their value toward the middle of the range is pursuing a goal that cannot be inferred from the test report. Whether one exists in an individual case is a matter for medical practice.
The statement also applies to the opposite case. A value at the lower end of the range is not automatically worse than one in the middle. Both are part of the 95%.
Where genuine target values exist
So that this article does not overstate the case in the other direction: Target values do exist. They just look different.
A target value comes from a study showing that a person does better when a value lies at a particular point. It applies to a specific question and a specific group.
An example appears in the MSD Manual: For maximum bone health, 25(OH)D target values should be above 20 to 24 ng/ml, that is, approximately 50 to 60 nmol/l (as of April 2025). It explicitly states what this target value applies to.
The difference can therefore be clearly stated. A reference range describes a group; a target value answers a question. A test report generally contains the former.
This can also be used to assess what you encounter online. Whenever optimal values or optimal ranges are mentioned, the follow-up question should be: optimal for what, according to which study, and for which group?
If this answer is missing, it is usually a narrower version of the reference range without an independent basis. A recommendation is then created from a distribution simply by shifting the limits, and this step is not supported by evidence.
Three statements in a fact check
These three statements come up as soon as a test report is on the table.
Checked against the evidence
Widespread
“Being in the middle of the range is best.”
Documented
The range is established based on measurements from many healthy people (IQWiG, as of April 2, 2025). The middle is where most people fall, not a recommendation.
Widespread
“Outside the range means you are ill.”
Documented
IQWiG writes: 5% of people have results outside the reference range even though they are healthy. An abnormal value therefore does not necessarily need to be treated (as of April 2, 2025).
Widespread
“The reference range is the same everywhere.”
Documented
Reference values may vary from one laboratory to another, which is why the information on your own test report is always decisive (IQWiG, as of April 2, 2025). They also often depend on age and sex.
What a marker on the test report means
The practical question is: What do I do when a line is marked?
The marker itself is purely a mathematical indication. It means that this value lies outside the limits derived from a distribution of measurements in healthy people. It says nothing more.
IQWiG notes the following: A single laboratory value is therefore always only one component of an overall diagnosis (as of April 2, 2025). And: Only in conjunction with other values, symptoms, and examinations does a clear picture emerge (as of March 20, 2025).
The takeaway is unremarkable: A flagged line belongs in a conversation at a medical practice, together with the complete report. It is a reason to ask questions, not a result.
A second consideration comes in as soon as a report contains many lines. If 5 percent of healthy people fall outside the range for each individual value, then with eighteen lines it becomes increasingly unlikely that none of them will be flagged.
This is not a calculation for a specific finding and does not make a statement about a specific value. It is why a single flag in a long list carries less weight than the same flag on a report with three lines.
This point, too, belongs in the conversation rather than in a separate assessment. However, it helps put the initial shock into perspective.
Who this information is practically useful for
The comparison concerns whether this understanding is useful to you in everyday life.
Helpful for you if …
You have a report with a flagged line in front of you and want to put it into context.
You want to know which questions you can ask at the medical practice.
You encounter offers featuring so-called optimal ranges and want to assess them.
You are comparing two findings and want to compare the reference ranges side by side.
Not sufficient if …
You want to know what your flagged line means. A medical practice can clarify that.
You are looking for a target value for yourself. This article does not provide one.
You are already undergoing evaluation. In that case, the medical practice that started it should continue it.
You expect a diagnosis. That is provided by a medical practice, not a self-test.
What a capillary blood test can show here
A capillary blood self-test does not make a diagnosis or define target values. What it provides is a number with the reference range of the analyzing laboratory.
For each of the 18 values, VitalCheck by mybody®x (MYBODY Lab GmbH) provides this range. What is stated in this article applies to each of these lines.
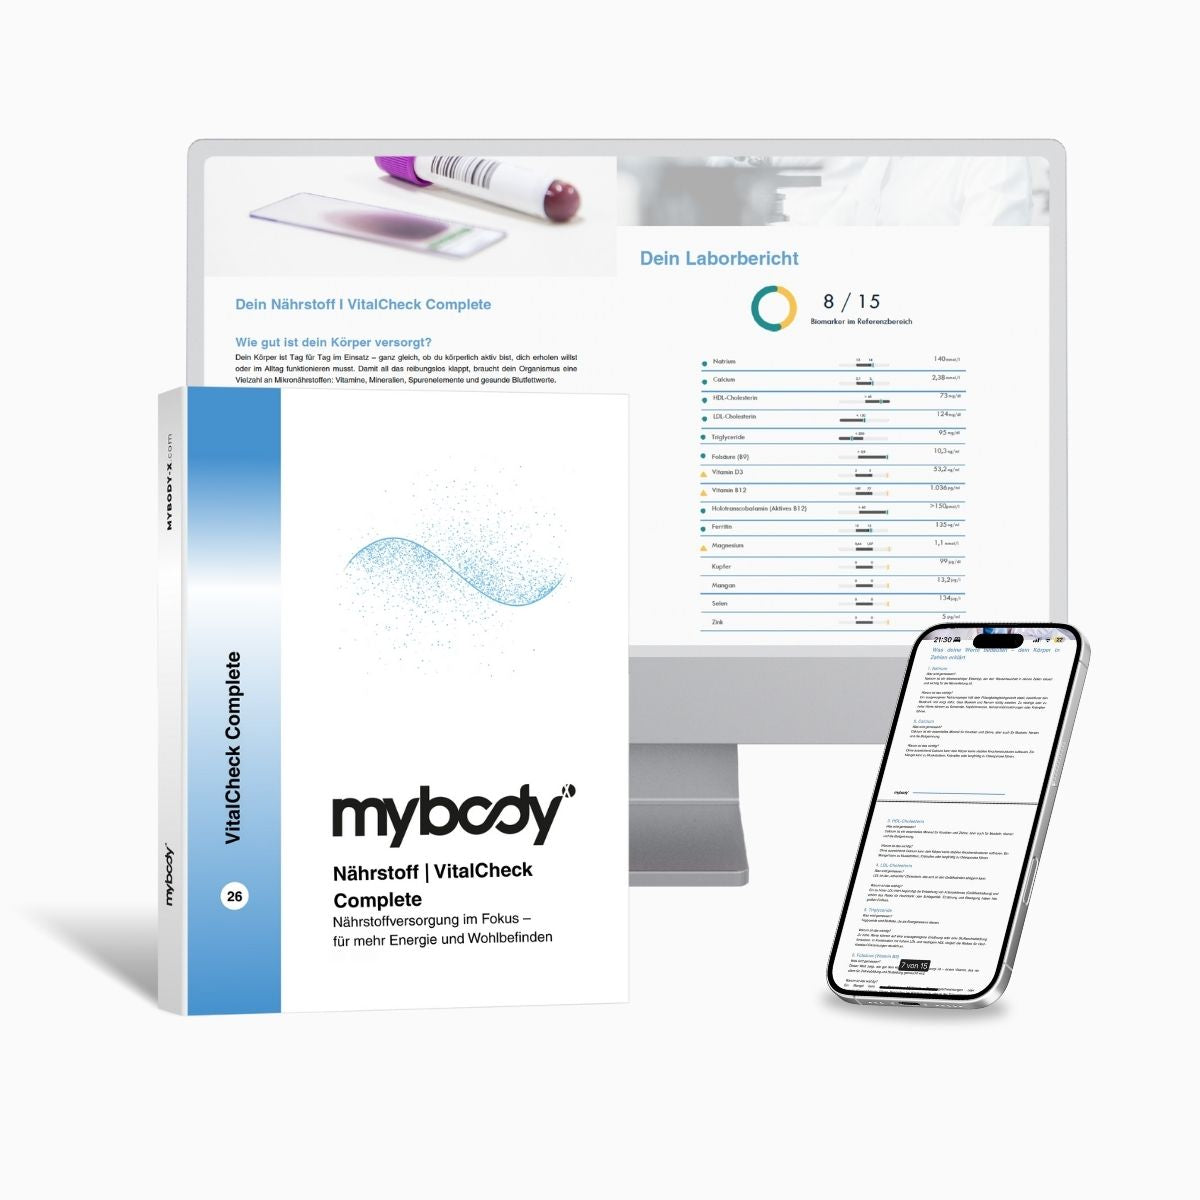
Capillary blood test
VitalCheck | Complete Nutrient & Mineral Test
Reports 18 values from the same sample, each with the reference range of the analyzing laboratory. What the test does not do: It provides no target values or optimal ranges, does not interpret flagged lines, does not make a diagnosis, and does not replace a medical examination.
Laboratory analysis 3–5 working days after sample receipt
Product page information, retrieved 19 August 2026
Chapter at a glance
A test using capillary blood provides figures with the laboratory’s reference range. This range describes a distribution, not a personal target value. Interpreting a flagged line belongs in a medical practice.
Limitations: what a reference range leaves open
The first limitation is the individual. A range describes a group. It does not say where an individual usually falls within that group.
The second limitation is meaning. A flag is a calculated piece of information. A single laboratory value is always just one component of an overall diagnosis (IQWiG, as of 2 April 2025).
The third limitation is comparability. Reference values can vary from one laboratory to another and often depend on age and sex. The information on your own test result is always authoritative.
The fourth limitation is diagnosis. All the explanations in this article provide context and are not diagnoses. A diagnosis is made in a medical practice based on several components, and no self-test can anticipate it.
What matters about the reference range
If you take away just one thing from this article, let it be this: The range next to your number describes other people.
It is usually established based on measurements from many healthy people, with the limits set so that 95 percent fall within the range. This means that 5 percent of healthy people fall outside it, and an abnormal value does not necessarily need to be treated (IQWiG, as of 2 April 2025).
Knowing this helps people read a test result more calmly and ask better questions. It also makes clear that the midpoint of the range is not a target. A medical practice can clarify what a highlighted line means in an individual case.
Frequently asked questions
How is a reference range established?
IQWiG describes it this way: Reference ranges for a laboratory value are usually established based on measurements from many healthy people, with the limits set so that 95 percent fall within the range (as of 2 April 2025). It is therefore a segment of a distribution.
Is a value outside the range a sign of illness?
Not necessarily. The same source notes that 5% of people have results outside the reference range even though they are healthy, so an abnormal value does not necessarily need to be treated (as of 2 April 2025). Interpretation belongs in a medical practice.
Should my value be in the middle of the range?
That does not follow from how a reference range is established. The midpoint is where most measurements from healthy people fall, not a recommendation for an individual. Whether there is a target value in a specific case is determined by a medical practice.
Why are some ranges so broad?
Because healthy people vary widely at this value. For ferritin, IQWiG gives 9 to 140 µg/l for women over 18 and 18 to 360 µg/l for men (as of 20 March 2025). For a tightly regulated value such as calcium, by contrast, the range is very narrow.
What is the difference from a target value?
A reference range describes a group; a target value answers a specific question. For example, the MSD Manual gives 25(OH)D target values above 20 to 24 ng/ml and explicitly states what they apply to: maximum bone health (as of April 2025). A test report generally lists the reference range.
Next step
Read values with their ranges
VitalCheck measures 18 values from capillary blood, each with the reference range provided by the evaluating laboratory. It does not specify target values, assess any flagged result, make a diagnosis, or replace medical evaluation.
To VitalCheckRead more
You might also be interested in
What two test reports need for a comparison to be meaningful.
The value with the narrowest range in this article.
Sources
- Institute for Quality and Efficiency in Health Care (IQWiG): Understanding laboratory values correctly, as of 2 April 2025 – gesundheitsinformation.de
- IQWiG: Ferritin, as of 20 March 2025 – gesundheitsinformation.de
- IQWiG: Calcium, as of 20 March 2025 – gesundheitsinformation.de
- IQWiG: Magnesium, as of 20 March 2025 – gesundheitsinformation.de
- IQWiG: Transferrin, as of 20 March 2025 – gesundheitsinformation.de
- MSD Manual, Professional Edition: Vitamin D deficiency and dependency, Johnson LE (last updated April 2025) – msdmanuals.com
The verbatim quotation on how reference ranges are established, the figures of 95 and 5 percent, the statement that treatment is not necessarily required, the urea example, the sentence about being one component of an overall diagnosis, and the note that reference values depend on the laboratory are taken from source [1]. The ferritin reference ranges are from [2]. The calcium reference range and the statement about hormonal regulation are from [3]. The magnesium reference range is from [4]. The transferrin reference range is from [5]. The 25(OH)D target values for bone health are from [6]. Information on price, values, sample type, and laboratory comes from the mybody®x product page, accessed on 19 August 2026; processing times follow the central specification for blood tests. All sources were accessed and reviewed on 19 August 2026.

mybody®x editorial & specialist team
Laboratory diagnostics Blood analysis interpretation Nutritional science Nutrigenetics
This article was created by the mybody®x editorial and specialist team. The team combines laboratory diagnostics, nutritional science, and the interpretation of blood analyses. Everyone who contributes to it is listed on the authors page.
Published on 19 August 2026 · Last updated on 19 August 2026
The content is intended for general information and does not replace medical advice, diagnosis, or treatment. Reference ranges depend on the laboratory, method, and age—your report always takes precedence.




Share now:
A value without a previous value is just a point
Capillary blood from the fingertip has its own rules