

Tips for evaluating test results: How to read health tests correctly
Tips for evaluating test results are the key to deriving concrete actions for your health from a DNA test, microbiome analysis, or nutrient check. Test evaluation is defined as the structured process of transforming raw data from health tests into understandable, decision-relevant insights. Anyone who masters this process makes better decisions about nutrition, supplementation, and lifestyle. Tools such as Excel, Google Sheets, and personalized dashboards make this process accessible even without statistical knowledge. This guide shows you step by step how to read test results correctly, avoid common mistakes, and use the insights directly for your health.
Tips for evaluating test results: What prerequisites and tools do you need?
Before you begin the evaluation, you need to define a clear objective. Before evaluating the results, you should define a clear goal so that you consider only the information relevant to your health decision. Specifically, are you wondering why you feel tired after eating? Or do you want to know whether your magnesium level affects your sleep? The more precise the question, the more useful the evaluation.
The good news for anyone without a degree in statistics: 90% of analysis tasks can be solved with simple spreadsheets such as Excel or Google Sheets if you focus on three core metrics. This means you don't need special software to achieve meaningful results. For health tests, a well-structured spreadsheet containing your measurements, reference values, and changes over time is often sufficient.

An overview of the three most important tools
You don't need much for a solid test evaluation. These three tools cover most requirements:
- Excel or Google Sheets: For recording, sorting, and calculating values. Google Sheets has the advantage that you can access it from any device.
- Simple dashboard: 95% of projects can get by with a 3x3 matrix, consisting of nine fields that monitor progress and data quality. For health tests, this means three main areas (e.g. nutrients, digestion, energy), each with three metrics.
- Reference ranges: Your test result alone says little. Only comparison with validated reference values makes a value like “Vitamin D: 28 nmol/l” interpretable.
Preparing data before analysis
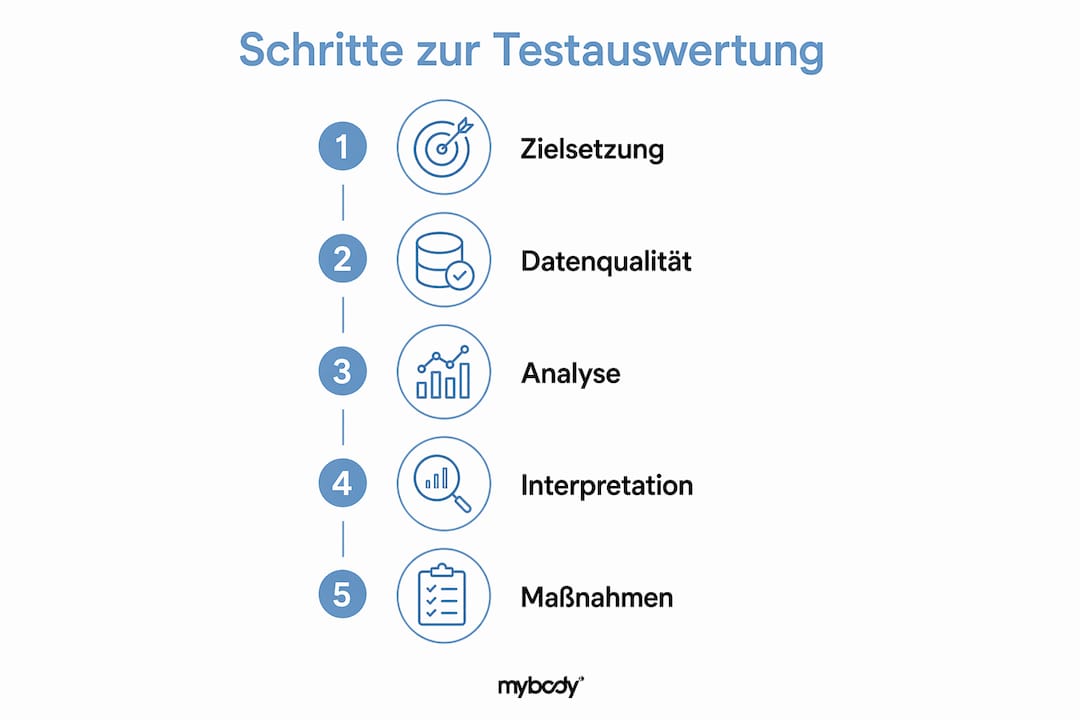
Before doing any calculations, check the quality of your data. Incomplete or incorrect entries distort every result. Check that all measurements are complete, that the units are consistent (e.g., nmol/l vs. ng/ml for vitamin D), and that the sample collection time is correctly documented. This step may sound trivial, but it is the most common cause of misinterpretation.
Pro tip: In Excel or Google Sheets, create a separate column for notes. Record any special circumstances there, such as illness, stress, or an unusual diet at the time of the test. This contextual information is crucial for interpretation later.
How do you analyze test data step by step?
A structured analysis follows a clear sequence. Skipping these steps can lead to incorrect conclusions. The following guide applies to all types of health tests, from DNA metabolism tests to microbiome analyses.
Step-by-step guide to analyzing results
-
Organize and categorize data. Enter all measurements into a table. Group them by area: nutrients, hormones, microbiome, metabolism. Consistent formatting (the same units and date format) prevents confusion later.
-
Calculate relevant metrics. For multiple measurements over time, calculate the mean and median. The mean shows the average, while the median is more resistant to outliers. If your vitamin B12 level was 280 pg/ml three times and 180 pg/ml once, the median is 280, but the mean is lower. Here, the median provides a more realistic picture.
-
Compare with reference values. Results lose meaning without context. Comparability with reference values is essential for making informed decisions. Use the reference ranges from the lab report and supplement them with population-specific standard values where available.
-
Present data visually. Charts and dashboards reveal patterns hidden in columns of numbers. A simple line chart of your iron levels over six months immediately shows whether the trend is rising, falling, or stagnating.
-
Interpret qualitatively. The number alone is not enough. Qualitative analysis—the “why” behind the numbers—is often more important than quantities alone. A low ferritin level combined with high physical exertion means something different from the same level in an office worker with a balanced diet.
Example table: Analyzing a nutrient test
| Nutrient | Measured value | Reference range | Assessment | Action |
|---|---|---|---|---|
| Vitamin D | 28 nmol/l | 75–150 nmol/l | Deficiency | Consider supplementation |
| Ferritin | 18 µg/l | 30–300 µg/l | Borderline | Adjust diet |
| Magnesium | 0.85 mmol/l | 0.75–1.0 mmol/l | Normal | No action required |
| Vitamin B12 | 280 pg/ml | 200–900 pg/ml | Normal | Monitor the trend |
This table shows how you can immediately derive three different areas for action from four values. Not every value requires a response. This is an important point: Analysis means prioritization, not panic.
Pro tip: Use pivot tables in Excel to structure larger datasets from multiple tests. Pivot tables condense data without changing the original values. This allows you to return to the raw data view at any time.
What typical mistakes should you avoid when analyzing test results?
Errors in test analysis rarely result from a lack of knowledge. They arise from impatience, overinterpretation, and a lack of context. These are the four pitfalls we encounter most often when analyzing health tests.
-
Confusing correlation with causation. A common mistake is confusing correlation with causation, which leads to misinterpretations. Just because your energy level and vitamin D level increased at the same time does not mean that vitamin D is the cause. Sleep, exercise, and stress reduction could just as easily be responsible.
-
Analyzing too many metrics at once. Focusing on three key figures prevents information overload. Anyone monitoring 15 values simultaneously loses track and makes poorer decisions than someone focusing on the three most critical ones.
-
Assessing results without context. A borderline value is not cause for alarm if it has been stable for years. A value within the normal range can be problematic if it has halved within three months. Context matters more than absolute numbers.
-
Overinterpreting small samples. Five individual values are not statistically meaningful. A single blood test provides a snapshot, not a diagnosis. Only multiple measurements over time reveal reliable trends.
-
Failing to check data quality. Different laboratories use different analytical methods and reference ranges. Comparing values from two different laboratories without adjusting the units leads to incorrect conclusions.
“Results must always be contextualized to avoid misinterpretation. Comparisons with reference values are essential in this regard.” Source: Skill-Sprinters, Fundamentals of Data Analysis
This principle applies especially to home tests. The results are valid, but their meaning only becomes clear in the context of your diet, lifestyle, and medical history.
How do you use test results specifically for your health and diet?
The true value of a health test lies not in the result itself, but in the actions you derive from it. This transfer from data to action is the step many people omit.
-
Adjust your diet strategically. A low ferritin level does not automatically mean that you should take iron tablets. Often, it is enough to deliberately include more iron-rich foods such as legumes, pumpkin seeds, or red meat while also combining them with vitamin C to aid absorption. A detailed step-by-step guide to optimizing your diet based on test results will help you implement this process systematically.
-
Prioritize areas for action. Not every deficiency is equally urgent. Prioritize based on two criteria: How far is the value outside the reference range? And which symptoms do you have that could be related to it? Vitamin D deficiency accompanied by fatigue and winter depression has a higher priority than a slightly elevated homocysteine level without symptoms.
-
Follow up regularly. An evaluation is not a one-time event. After every dietary adjustment or supplementation, schedule a follow-up measurement after three to six months. This is the only way to determine whether your measures are working. This cycle of testing, evaluating, adjusting, and retesting is the core principle of personalized health optimization.
-
Build a personalized dashboard. Enter your values over time into a simple dashboard. A table with the date, measurement, reference range, and action is entirely sufficient. This allows you to identify trends over months and years that individual measurements do not reveal. Structuring your self-test process from the outset will save you considerable effort interpreting the results later.
-
Consider genetic factors. Some nutrient deficiencies have genetic causes. For example, people who carry an MTHFR gene variant metabolize folate less efficiently. A DNA test can explain why certain values repeatedly appear abnormal despite a balanced diet. The impact of genetic analysis on nutrition and health is an area that meaningfully complements traditional blood tests.
The key point: Test results are tools, not judgments. They show where you stand. What you do with them is up to you.
Key insights
Effective test evaluation improves health decisions when you set clear goals, focus on a few metrics, and always interpret results in context.
| Point | Details |
|---|---|
| Define your goal before the evaluation | Clear questions prevent information overload and direct the focus toward relevant values. |
| Prioritize no more than three metrics | Focusing on the most critical values leads to better decisions than analyzing 15 metrics at once. |
| Context is crucial | Reference values, the course over time, and personal circumstances are what make a measurement interpretable. |
| Don’t forget qualitative analysis | The “why” behind the numbers explains which measures are truly worthwhile. |
| Schedule regular follow-up measurements | Only comparing multiple measurements over time shows whether interventions are working. |
What I’ve learned from hundreds of evaluations
At mybody x, we see every day how people read their test results. And the most common mistake is not a lack of knowledge. It is overinterpreting a single value without context.
Those evaluating a nutrient test for the first time tend to treat every value outside the reference range as a problem. This leads to unnecessary supplementation, unfounded dietary changes, and sometimes genuine anxiety. The reality is more nuanced: Reference ranges are statistical constructs based on population averages. A value just below the range in a healthy, active person is often less meaningful than a value within the normal range that has halved over the course of three months.
What really helps is patience with the process. One test is a snapshot. Two tests are a data point. Three tests over six months are a trend. Only trends justify taking action. That is why we always recommend that our customers view the first test as a baseline, not a diagnosis.
The second point I’d like to share from practice: Qualitative observations are just as valuable as lab results. If you feel better, have more energy, and sleep better after changing your diet, that is a valid signal—even if the next blood test does not yet show a dramatic difference. Bodies respond more slowly than lab curves.
My honest advice: Use tools like Excel or Google Sheets for structure, but also trust your own awareness of your body as a complement. Together, they provide the complete picture.
— MYBODY X
Understand your health with mybody x
Once you know how to read test results correctly, the next step is taking the right tests. mybody x offers ISO-certified analyses for DNA, the microbiome, nutrients, hormones, and intolerances, all conveniently performed at home.

Each test provides a personalized report with specific dietary recommendations, lifestyle tips, and areas for action. You receive not just numbers, but an analysis you can apply immediately. With more than 11,300 satisfied customers and a rating of 4.77 stars, mybody x is a reliable partner for anyone who wants to manage their health based on data. Discover the right test for you at mybody-x.com and start with a solid foundation for your next analysis.
FAQ
What is the first step in analyzing test results?
The first step is defining your objective: Before analyzing values, determine which question you want to answer. This prevents information overload and keeps the analysis focused on what matters.
How many metrics should I analyze at the same time?
Focus on a maximum of three relevant metrics per analysis. Analyzing more metrics at once leads to overload and poorer decisions, as analyses of data evaluation show.
How can I tell whether a test result is genuinely problematic?
A single value outside the reference range is rarely a cause for alarm. Only comparisons with previous measurements, the progression over time, and your personal symptoms make a result interpretable.
Which tools are suitable for analyzing health tests?
Excel and Google Sheets cover most requirements. For structured analysis of larger datasets, pivot tables in Excel are particularly useful because they condense data without changing the original values.
How often should I retest my health values?
After adjusting your diet or starting supplementation, a follow-up measurement after three to six months is recommended. Only multiple measurements over time provide reliable trends and show whether your measures are working.
Recommendation
- Perform a blood test at home: Guide to accurate results – mybody®x
- Optimize your diet based on test results: Step-by-step guide – mybody®x
- Test for nutrient deficiencies: Recognize symptoms & address deficiencies specifically – mybody®x
- Lab tests at home: Your guide to greater health and well-being – mybody®x



Share now:
Metabolomics Analysis Basics Explained: Your Body Profiled
Egg intolerance symptoms: What helps now in 2026