

What boosts fat burning? The levers put to an honest test
The essentials at a glance
Boosting fat burning means increasing the proportion of fat your body is currently using as energy. Four levers have been shown to be effective: an energy deficit, everyday movement, muscle mass, and a higher protein intake. However, without an energy deficit, a higher rate of fat burning does not change your fat mass.
This article ranks the known levers by strength of evidence and gives a verified figure for each, along with the institution and year. It also explains where genetic analysis applies—and where it does not: mybody®’s WeightLoss | SLIM DNA test (MYBODY Lab GmbH) analyzes more than 80 gene variants from a saliva sample for €169.00, providing 24 analysis reports in five chapters. It shows genetic predispositions. It does not measure current calorie expenditure and does not provide a diagnosis.
Read Chapter 2 on energy balance, Chapter 6 for a direct comparison of all the levers, and Chapter 10 if you are considering whether DNA analysis is right for you.
What to expect in this article
2. Why nothing happens overall without an energy deficit
3. How much can daily energy expenditure actually be changed?
4. Is it worth deliberately working on fat burning?
5. Why everyday movement has the greatest impact
6. Which lever makes how much difference? The direct comparison
7. How much impact do muscle mass and protein intake have?
8. What difference do caffeine, sleep, and meal timing make?
9. How mybody® can help
10. Putting it into perspective: What a DNA test can—and cannot—do
11. Conclusion
Frequently asked questions
Sources
Fat burning or fat loss—which do you actually mean?
Fat burning and fat loss are two different things. Fat burning—technically, fat oxidation—describes what proportion of its energy your body is currently obtaining from fatty acids. Fat loss describes whether the amount of fat tissue becomes smaller over a period of weeks.
The proportion of fat oxidation can be shifted easily in the short term, for example through low-intensity endurance exercise or a low-carbohydrate meal. Stored fat mass does not automatically follow this shift.
Over 24 hours, the body operates using a mix of fat and carbohydrates. If you oxidize more fat during a workout, you generally oxidize correspondingly less in the hours afterward. The balance over the course of the day is what matters.
Key point: A higher rate of fat burning only shifts where the energy is coming from at that moment. Whether fat tissue is broken down is determined solely by the energy balance over longer periods. The German Nutrition Society (DGE, 2012) identifies energy intake adapted to energy requirements—or a negative energy balance—as decisive for body weight.
This also makes clear what the question “What stimulates fat burning?” means in practical terms: The goal is to find levers that noticeably increase total energy expenditure or help keep energy intake below it over the long term. Everything else is a shift without a net effect.
This article assesses the levers according to the strength of the evidence and explicitly identifies those that deliver measurably little. The biological processes behind them—lipolysis, fatty acid transport, and mitochondria—are explained in Metabolism and Fat Burning. Common claims about ginger shots, cold showers, and breakfast are examined How to naturally stimulate your metabolism, and how to incorporate these levers into your daily routine, is explained in How do I activate my metabolism?. A shorter version of the topic appears in the guide What stimulates fat burning?—this article also organizes the same levers by strength of evidence.
Why nothing happens net without an energy deficit
Without a negative energy balance, the body does not break down fat tissue—regardless of how high the proportion of fat is in current energy production. This is the framework within which all other levers operate.
The German Nutrition Society (DGE) states this directly in its 2012 technical information sheet on meal frequency and weight regulation.
“
“What is decisive for body weight is an energy intake adapted to energy requirements, resulting in a balanced energy balance or a negative energy balance.”
German Nutrition Society (DGE)
Technical information sheet “Meal Frequency and Weight Regulation in Adults,” 2012
The consequence is harsh: Every lever works only to the extent that it affects the energy balance—through expenditure or intake. A measure that affects neither cannot change fat mass.
How strongly the body counteracts an imbalance is shown by a classic overfeeding study. With an additional 1,000 kilocalories per day, participants’ total energy expenditure increased by only 554 kilocalories per day, around 60% of which came from unconscious everyday movement; the individual range extended from −98 to +692 kilocalories per day (Levine et al., 1999, cited in Endotext, as of 2022).
The same principle applies in the other direction. After weight loss, resting energy expenditure decreases in addition to what the weight loss itself explains—Martin and colleagues (International Journal of Obesity, 2022) quantify this metabolic adaptation at around 40 kilocalories per day. This explains why a deficit established once becomes smaller over time if no one adjusts it.
How much of your daily energy expenditure can you actually change?
Daily energy expenditure consists of three components that differ in size and in how much they can be influenced. Knowing their distribution lets you immediately put every promise into perspective.
According to the Institute for Quality and Efficiency in Health Care (IQWiG, 2022), resting energy expenditure accounts on average for about 70% of calorie needs. Energy expenditure from physical activity accounts for around 20%, while the thermic effect of food accounts for the remaining roughly 10%.
The largest component is therefore also the least freely controllable. The Institute for Quality and Efficiency in Health Care (IQWiG, 2022) states verbatim: “A person’s resting energy expenditure depends primarily on the proportion of muscle mass in their body weight.” Muscle mass can be built, but only slowly and to a limited extent.
The smallest component is the one most promises target. According to the German Nutrition Society (DGE, as of 2025), the thermic effect of food accounts for about 10% of total energy expenditure. Adjusting it shifts only part of one-tenth—mathematically, that is all there is.
Does energy expenditure change with age?
The widespread claim that fat burning “slows down after 30” does not stand up to scrutiny. An analysis by Pontzer and colleagues (Science, 2021) shows that energy expenditure relative to fat-free mass remains stable from ages 20 to 60 and only then declines by around 0.7% per year.
What usually changes at this stage of life is body composition and the amount of everyday movement. Both can be influenced.
Is it worth working specifically on fat burning?
Working specifically on fat burning is worthwhile when a realistic energy deficit is taken into account. Without this framework, it remains busywork focused on a variable that does not change fat mass.
The following comparison answers the question in both directions. The right-hand column contains genuine exclusion criteria—situations in which specifically working on fat burning offers little benefit or is the wrong first step.
Makes sense for you if …
… you primarily work sitting down. That is where the greatest untapped range lies: Inactive movement accounts for only 6 to 10% of total energy expenditure in a sedentary lifestyle (Endotext, as of 2022).
… you have maintained a deficit for months and are still stuck on a plateau. The metabolic adaptation of around 40 kilocalories per day (Martin et al., 2022) is a real part of the explanation.
… you want to retain as much muscle as possible while losing weight—then protein intake and strength training are the key levers.
Not really, if …
… you are not aiming for an energy deficit and do not want to maintain one. In that case, greater fat oxidation has no effect on fat mass—the work would be futile.
… you are underweight, have an eating disorder, or are losing weight unintentionally. These situations require medical support, not a self-optimization project.
… you have unexplained symptoms: persistent fatigue, a racing heart, or major unintentional weight changes should be medically evaluated before you adjust your diet and training.
For most people with sedentary jobs, the effort is well invested—but not in the order that advice guides typically suggest. The biggest item is not on the training plan.
Why everyday movement is the biggest lever
Everyday movement has the greatest established range of all the levers. This does not mean exercise, but everything else: walking, standing, climbing stairs, and housework. In the scientific literature, this is referred to as NEAT—non-exercise activity thermogenesis.
According to von Loeffelholz and Birkenfeld (Endotext, as of 2022), the NEAT difference between two people of the same size can be up to 2,000 kilocalories per day. Its share of total energy expenditure is 6 to 10% with a sedentary lifestyle and 50% or more in very active people.
No substance, drink, or meal distribution comes close to this range. The greatest established difference does not arise during the hour of training, but during the 23 hours before and after it.
The greatest established difference does not arise during the hour of training, but during the 23 hours before and after it.
One qualification is important: The 2,000 kilocalories describe the gap between two extremes, not the gain for an individual person from walking more.
Key point: Everyday movement is the lever with the greatest established range. Its share of total energy expenditure ranges from 6 to 10% with a sedentary lifestyle to 50% or more in very active people (Endotext, as of 2022).
There is an institutional recommendation for the practical magnitude. The DGE states: “Around 30 to 60 minutes of moderate physical activity per day promotes health, stimulates muscle growth, and helps regulate weight.”
Which lever makes how much difference? The direct comparison
The six best-known levers differ less in whether they work than in how strongly and how well established their effects are. The following overview compares them according to the same three criteria: established magnitude, certainty of the evidence, and effort.
| Lever | Established magnitude | How well established? | Effort |
|---|---|---|---|
| Energy deficit | The framework for every other lever; after weight loss, resting energy expenditure decreases by an additional approximately 40 kcal per day (Martin et al., 2022) | Very well established—the DGE (2012) identifies a negative energy balance as decisive | High, because it is ongoing and requires continual adjustment |
| Everyday movement (NEAT) | 6–10% of total energy expenditure in sedentary lifestyles, 50% or more in very active people; the difference between two people of the same size can be up to 2,000 kcal per day (Endotext, as of 2022) | Well established, but with very large individual variation | Small per individual step, but distributed throughout the day |
| Muscle mass and resistance training | Resting energy expenditure increased by around 73 kcal per day, or about 5% (Aristizabal et al., 2015); skeletal muscle uses around 12.6 kcal per kg per day compared with 4.4 kcal for adipose tissue (Wang et al., 2010) | Well established—the effect is real, but smaller than often claimed | High: several months of regular resistance training |
| Protein content of the diet | Thermic effect: protein 20–30%, carbohydrates 5–10%, fat 0–3% of energy consumed (after Tappy, 1996, cited in Mustafa et al., 2024) | Well established for the individual nutrient; it operates only within the approximately 10% share attributable to digestion | Small: redistribution within meals |
| Caffeine | Around 4.8% higher energy expenditure over 24 hours (Hursel et al., 2011) | Demonstrated, but measured as a short-term effect over approximately three hours (Astrup et al., 1990) | Very small |
| Meal timing | No demonstrated effect; randomized intervention studies found “no clear evidence of an association between meal frequency and body weight” (DGE, 2012) | Well studied—the DGE (2012) considers no firm recommendation possible | Small, but with no demonstrated benefit |
The table reveals a pattern: The more convenient a lever is, the smaller its documented effect. The two most effective factors—an energy deficit and everyday movement—require consistency.
How much do muscle mass and protein intake matter?
Muscle mass and protein intake both have measurable effects, but they are smaller than the commonly cited rules of thumb suggest. Their real value lies in preserving muscle during a calorie deficit.
The tissue analysis by Wang and colleagues (American Journal of Clinical Nutrition, 2010) provides the scale: Skeletal muscle uses around 12.6 kilocalories per kilogram per day, while adipose tissue uses around 4.4 kilocalories. Thus, one additional kilogram of muscle mass theoretically provides around eight kilocalories per day compared with adipose tissue.
In practice, the overall effect of a training program is greater because training changes more than just the amount of tissue. In an intervention study by Aristizabal and colleagues (European Journal of Clinical Nutrition, 2015), resting energy expenditure increased by around 73 kilocalories per day, or about 5%—with substantial individual variation.
73 kilocalories per day are no reason to skip strength training, but they are not a shortcut either. The real benefit is losing little muscle during weight loss—lost muscle permanently lowers resting energy expenditure.
Protein: the macronutrient with the highest thermic effect
Every meal requires energy to process, and the amount varies greatly by nutrient: protein 20 to 30%, carbohydrates 5 to 10%, fat 0 to 3% of the energy consumed (according to Tappy, 1996, cited in Mustafa et al., 2024).
This range sounds large, but it applies only within the smallest component. Since the thermic effect of food accounts for about 10% of total energy expenditure according to the DGE (as of 2025), a higher proportion of protein shifts part of one-tenth.
The practically more important effect of protein concerns intake: Protein-rich meals keep you full longer. This makes it easier to maintain an energy deficit without constantly feeling hungry.
Four questions for evaluating every fat-burning claim
- ✓ Fat oxidation or fat mass? – A higher proportion of fat in momentary energy production says nothing about fat loss.
- ✓ Is an order of magnitude provided? – Without a number, an effect can neither be classified nor disproved.
- ✓ Has the energy balance been taken into account? – If a measure affects neither expenditure nor intake, it cannot change fat mass.
- ✓ Do the measurement conditions and the recommendation match? – An effect measured over three hours does not tell us anything about an entire day.
The following overview shows the order in which the effort is worthwhile—ranked by demonstrated effect.
Clarify your energy balance
According to the DGE (2012), body weight is determined by energy intake that is adjusted to energy needs—or by a negative energy balance. Without this framework, no other lever has a net effect.
Increase everyday movement
According to Endotext (as of 2022), NEAT accounts for 6 to 10% of total energy expenditure in a sedentary lifestyle—and 50% or more in very active people.
Strengthen your muscles
The WHO (2020) recommends muscle-strengthening activity on at least two days per week, in addition to 150 to 300 minutes of moderate-intensity aerobic activity.
Distribute protein
The thermic effect is 20 to 30% for protein, compared with 0 to 3% for fat (according to Tappy, 1996, cited in Mustafa et al., 2024)—and protein keeps you full longer.
What do caffeine, sleep, and meal timing do?
Of these three levers, one works indirectly, one weakly, and one not at all—yet all three regularly appear among the “fat-burning boosters.”
Caffeine: measurable, but only a few percent
Caffeine measurably increases energy expenditure. In the analysis by Hursel and colleagues (Obesity Reviews, 2011), caffeine increased energy expenditure over 24 hours by around 4.8%.
This magnitude is far below what everyday physical activity can achieve. There is also a time limitation: Astrup and colleagues (American Journal of Clinical Nutrition, 1990) measured caffeine’s thermogenic effect as a short-term effect over three hours.
One frequently mentioned additional lever does not hold up: An effect of catechins on energy expenditure independent of caffeine has not been demonstrated. Green tea is not a separate lever beyond the caffeine it contains.
Sleep: affects appetite, not expenditure
Sleep deprivation does not increase calorie expenditure—it shifts the hormones that regulate appetite and therefore affects the intake side of the energy balance.
Spiegel and colleagues (Annals of Internal Medicine, 2004) found that with 4 instead of 10 hours in bed, leptin was 18% lower, ghrelin was 28% higher, and feelings of hunger were 24% stronger. Those who chronically sleep too little are therefore working against a hormonal state that pushes appetite upward.
Meal timing: no proven lever
Based on current evidence, how often you eat during the day is not a lever for body weight. In its 2012 technical information, the DGE states that no substantiated recommendations can be made about how often healthy people should eat to lose or maintain body weight.
According to the same DGE technical information (2012), randomized intervention studies provided “no clear evidence of an association between meal frequency and body weight.” Changing the number of meals changes the daily routine—not energy expenditure.
In brief
Caffeine increases energy expenditure over 24 hours by around 4.8% (Hursel et al., Obesity Reviews, 2011), measured as a short-term effect over three hours (Astrup et al., 1990). Sleep affects appetite rather than expenditure: With 4 instead of 10 hours in bed, leptin decreased by 18% and ghrelin increased by 28% (Spiegel et al., Annals of Internal Medicine, 2004). Regarding meal frequency, the German Nutrition Society (2012) does not consider a substantiated recommendation possible. These three levers neither replace an energy deficit nor more everyday physical activity.
How mybody® can help
mybody® offers a genetic analysis from a saliva sample for this topic. It answers a different question than “How much do I burn?”—namely, which predispositions exist in nutrition, nutrient requirements, and metabolic function. It does not measure current calorie expenditure, provide a diagnosis, or predict weight-loss success.
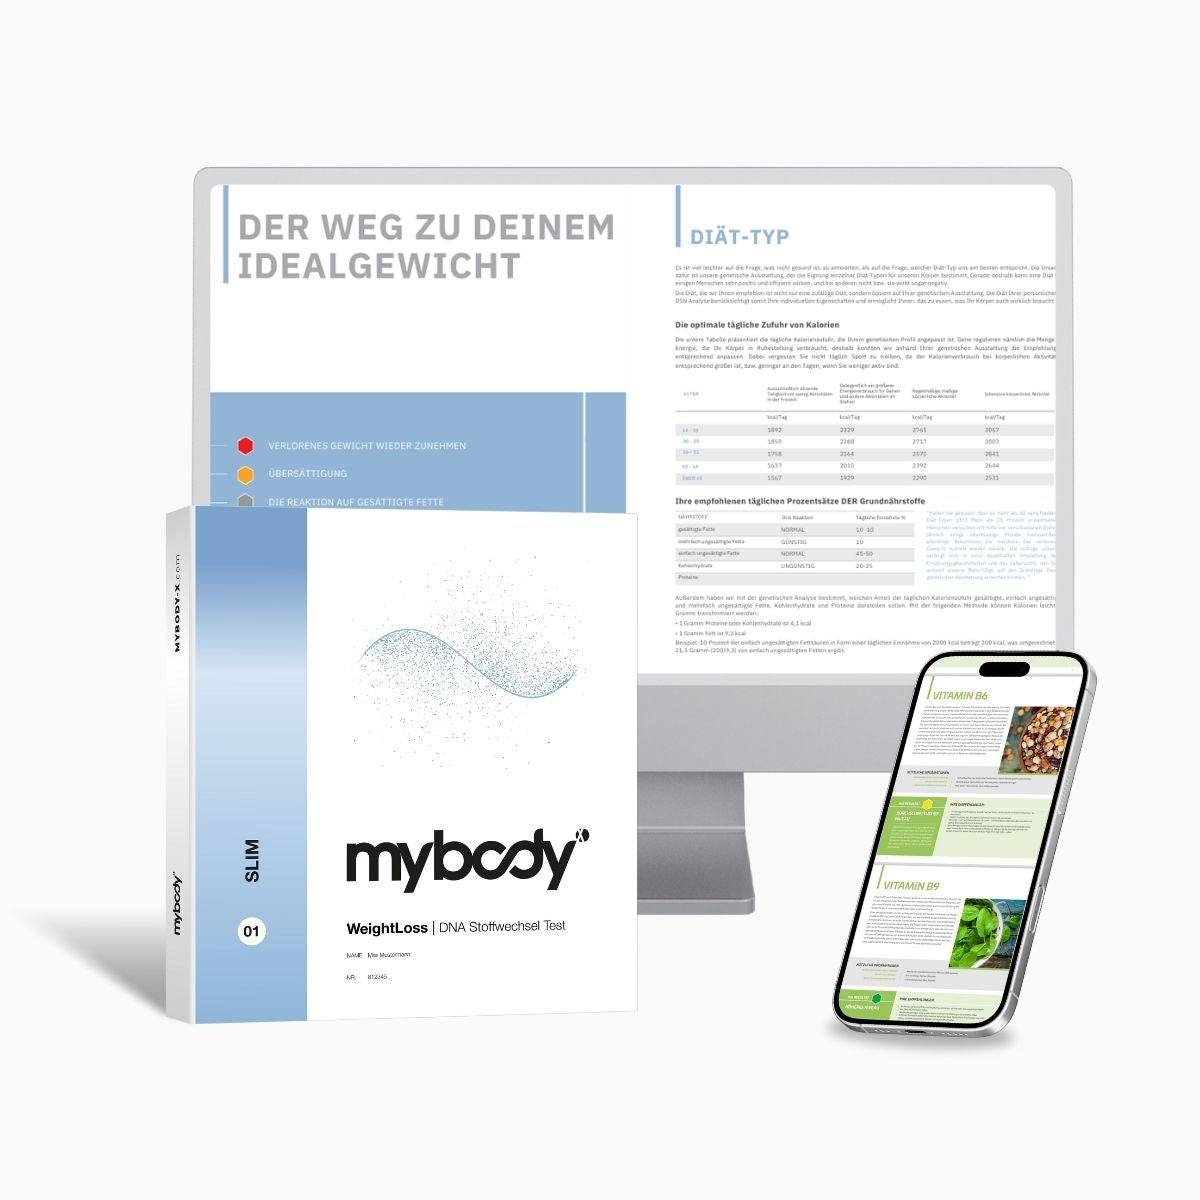
WeightLoss | SLIM DNA Test
The WeightLoss | The SLIM DNA Test analyzes more than 80 gene variants from a saliva sample. The result consists of 24 analysis reports in five chapters spanning around 140 pages: Nutrition & Diet (7 reports), Vitamin & Mineral Requirements (8), Metabolic Function (4), Body & Detoxification Process (2), and Cardiovascular System (4).
The test provides no diagnosis, no measured calorie expenditure, and no prediction of weight-loss success. It categorizes predispositions that do not change over the course of your life.
Price: €169.00 · Sample type: saliva sample · Processing time: approx. 15–20 business days after receipt of the sample · Laboratory: ISO-certified laboratory analysis, GDPR-compliant
To WeightLoss | SLIM DNA TestPrice information as of July 28, 2026. Prices, analysis scope, and processing times may change—the linked product page is authoritative.
For context: mybody® is part of MYBODY Lab GmbH and has the saliva samples analyzed in an ISO-certified laboratory. The samples are processed pseudonymously, results are transmitted using SSL encryption, and data processing complies with the GDPR.
Context: What a DNA test can—and cannot—do
A DNA test does not measure fat burning. It reads and categorizes gene variants—an entirely different type of information from a measurement of your current state.
Specifically, this means: the WeightLoss | The SLIM DNA Test does not tell you how many kilocalories you burn per day. Reference values are used for that, such as the breakdown into around 70% resting metabolic rate, 20% activity-related energy expenditure, and 10% energy used for digestion (IQWiG, 2022).
Nor does a DNA test provide a diagnosis or predict weight-loss success. Genetic predispositions are probabilities, not findings. They do not change over the course of your life because the gene variants being examined do not change.
And no analysis replaces the levers discussed here. If you do not maintain an energy deficit, move very little, and eat little protein, a saliva sample will not change that.
Conclusion
What boosts fat burning is less spectacular than the question might suggest. Four levers drive the effect: an energy deficit, everyday movement, muscle mass, and a higher proportion of protein. Everything else plays in a smaller league.
The figures make this clear: NEAT differences of up to 2,000 kilocalories per day (Endotext, as of 2022) on the one hand, compared with around 4.8% from caffeine (Hursel et al., 2011) and around 73 kilocalories per day after a training program (Aristizabal et al., 2015) on the other.
It is equally important to understand what does not work: Higher fat oxidation without an energy deficit does not change fat mass, and according to the German Nutrition Society (2012), meal frequency is not an evidence-based lever for body weight.
In practical terms, over the next few weeks: First, clarify your energy balance, increase walking and standing throughout the day, include muscle-strengthening activity on at least two days per week (WHO, 2020), and distribute protein across your meals. This is the evidence-based toolkit. A DNA analysis may additionally show which predispositions you have—but nothing more.
Frequently asked questions about fat burning
Do you want to know your genetic predispositions?
Over 80 genetic variations from a saliva sample, 24 analysis reports in five chapters, approximately 15–20 business days after receipt of the sample, ISO-certified laboratory analysis, GDPR-compliant. The test shows predispositions—it is not a diagnosis and does not predict weight-loss success.
Get the WeightLoss | SLIM DNA test View all DNA metabolism testsYou might also be interested in this
→ Metabolism and fat burning
The biology behind it: lipolysis, fatty acid transport, and what actually happens in the cell.
→ Naturally stimulate your metabolism: What works—and what is merely claimed
Evaluation of methods and myth check on boosters, ginger shots, and cold showers.
Sources
- German Nutrition Society (DGE): Meal frequency and weight regulation in adults (2012)
- German Nutrition Society (DGE): Stay active and watch your weight
- Institute for Quality and Efficiency in Health Care (IQWiG): Causes of obesity (2022)
- Wang Z. et al.: Specific metabolic rates of major organs and tissues across adulthood. Am J Clin Nutr 92(6) (2010)
- von Loeffelholz C., Birkenfeld A. L.: Non-Exercise Activity Thermogenesis in Human Energy Homeostasis. Endotext (as of 2022)
- World Health Organization: Guidelines on Physical Activity and Sedentary Behaviour (2020)
The institute quotation and statements about meal frequency are based on [1]. The recommendation of around 30 to 60 minutes of moderate activity per day comes from [2], while the division into resting metabolic rate, activity energy expenditure, and the thermic effect of food comes from [3]. The values for muscle and adipose tissue come from [4], the information on everyday movement and NEAT, including the cited overfeeding study, comes from [5], and the physical activity recommendations come from [6]. All other studies mentioned in the text – Aristizabal et al. (2015), Hursel et al. (2011), Astrup et al. (1990), Spiegel et al. (2004), Martin et al. (2022), Pontzer et al. (2021) – are cited directly at the relevant point with the authors, academic journal, and year. All product information about mybody® (MYBODY Lab GmbH) comes from the official product pages at mybody-x.com, as of July 28, 2026.

mybody® Editorial & Expert Team
Energy metabolism Fat metabolism Nutritional science Nutrigenetics Laboratory diagnostics
This article was written and medically reviewed by the mybody® editorial and expert team at MYBODY Lab GmbH. The team combines expertise in nutritional science, laboratory diagnostics, blood analysis interpretation, microbiome research, and nutrigenetics. Learn more about the people behind it on the mybody® authors’ page.
Published on July 28, 2026 · Last updated on July 28, 2026
Medical notice: This article is intended for general information and does not replace medical advice, diagnosis, or treatment. A DNA test provides indications of predispositions, not diagnoses or a prognosis regarding weight-loss success. If you experience unexplained weight loss, persistent exhaustion, a racing heart, or other unclear symptoms, please consult a doctor. If you take medication, are pregnant, or are breastfeeding, discuss dietary changes and an energy deficit with a doctor in advance.




Share now:
What does a DNA metabolism test tell you? The honest answer
Why am I not losing weight with intermittent fasting? The most common reasons