

The second blood test answers what the first one shows
The key points at a glance
A single laboratory value systematically leaves one question open: whether it is a condition or an outlier.
This is not a weakness of the laboratory. IQWiG quantifies how many healthy people have results outside the reference range, and the number surprises most people.
You will read about four situations compared, the cited source in its original wording, three common statements examined in a fact check, three documented details, and a clear statement of what a second value cannot do.
What to expect in this article
1. What a single value leaves open
2. Why one value raises two questions
3. Four situations compared
4. What a previous value can achieve
5. The documented source
6. The five percent and what it means
7. Three statements in the fact check
8. The core idea in one sentence
9. What a second value cannot do
10. Three documented details
11. What is needed for a sound comparison
12. Who can benefit from a second test result
13. What a capillary blood test can show here
14. Limitations: what even two values leave open
15. What matters for the second value
Frequently asked questions
Sources
What a single value leaves open
A test result comes back, a number is just outside the range, and immediately the mental arithmetic begins. What does this mean now?
What is missing at this moment is rarely another explanation. What is missing is a point of comparison.
Because a single value can mean two completely different things, and it looks the same in both cases. It may be a condition that has persisted for months. Or it may be a snapshot that looks different tomorrow.
This article describes what a second value can achieve methodologically. It does not recommend a testing schedule or specify an interval; that is the subject of a separate article.
Why one value raises two questions
The two questions attached to a single number are almost never asked separately.
The first is: Where does this value fall? The reference range on the test report answers that question, and the answer is unambiguous.
The second is: Is this my usual value? In other words, is it there because it is normally there for me, or is it there because something was different that day? A single result cannot answer that—and fundamentally cannot do so.
This is exactly the second question that a previous value answers. Not by providing greater accuracy, but by making it possible to compare one number with another.
Four situations compared
The table compares four starting points. It provides context and does not constitute a diagnosis.
| Starting point | What can be said | What remains open | What the question concerns |
|---|---|---|---|
| A value, within the range | That it was within the range on that day | Whether it changes and in which direction | A later comparison value answers it |
| A value, just outside the range | That it was outside the range on that day—and that 5% of healthy people are as well (IQWiG, as of 02/04/2025) | Whether it is a sustained state or a one-off outlier | A medical practice decides on the next steps |
| Two values, both within the range | Where the value lies and whether it has changed between the two time points | What caused a change—the reason is not stated in the report | A consultation at a medical practice |
| Two values, one outside the range | That something has changed—and in which direction | Whether the change is significant | A medical practice alone |
The far-right column is similar in all four rows. The difference is not who decides, but how much information is available when the decision is made.
What a prior value provides
The benefit of a prior value is unremarkable and can be stated in one sentence: It turns a point into a trajectory.
One point has no direction. Two points do, and that direction is often the actual information.
An example from this blog: With CRP, it is difficult to interpret a single result because the value responds to very different circumstances. Two values taken at an interval, by contrast, show whether anything has changed.
The same idea applies to most values in a nutrient panel. A ferritin value of 45 conveys a different message if it was 80 a year ago than if it was 30 a year ago—even though the same number appears on the report today in both cases.
What matters here is what a prior value is not. It is not a better value, a second opinion, or a confirmation. It is a reference point, and without it the first value lacks a dimension.
Why this cannot be established afterward
One aspect of this issue is uncomfortable and rarely stated: A prior value cannot be obtained retroactively.
If a result is on the table today and the question is whether this value has always been like this, that question can only be answered if someone took a measurement a year ago. Otherwise, it remains open, no matter how many tests follow.
This is the only reason why a measurement without an acute indication can be objectively justified: It creates a reference point for later. Not because it reveals something today, but because it makes something interpretable tomorrow.
This also makes clear what this reason does not support. It does not justify a short interval or repetition without purpose. A single documented baseline value already does almost everything needed to answer this question.
The documented source
Why a single value has this uncertainty in the first place is stated in one sentence from a public source.
Documented source
“5% of people have results outside the reference range—even though they are healthy.”
Institute for Quality and Efficiency in Health Care
IQWiG, gesundheitsinformation.de, Understanding laboratory values correctly, as of April 2, 2025
This sentence is not a criticism of the laboratory. It describes how a reference range is constructed.
The same source explains it this way: Reference ranges for a laboratory value are usually established based on measurements from many healthy people, with the limits set so that 95% fall within the range (as of 2 April 2025).
If 95% are inside, 5% are outside. These 5% are not sick people, but the remainder of the distribution.
The five percent and what it means
This number becomes interesting once it is applied to a report with many values.
With a single value, a result outside the range is a rare occurrence. In a report with many lines, it becomes unlikely that not a single line will be flagged.
This is not a calculation that this article performs for you, nor is it a statement about a specific finding. It is why a single flag, considered on its own, says little.
The IQWiG states generally: A single laboratory value is therefore always only one component of an overall diagnosis (as of 2 April 2025). And according to the same source, an abnormal value does not necessarily have to be treated.
The same source gives an example that makes this clear: An elevated urea level may indicate kidney disease or an especially meat-rich diet (as of 2 April 2025). Two very different explanations, one identical number.
A previous value does not resolve this example, nor is it supposed to. What it does is shift the question: from what this number means to whether it has changed.
This second question is narrower and therefore easier to answer. It is also the question that actually helps move a conversation forward.
Three statements in a fact check
These three statements come up as soon as a second test is mentioned.
Checked against the evidence
Common
“A value outside the range means that something is wrong.”
Documented
The IQWiG writes: 5% of people have results outside the reference range even though they are healthy, so an abnormal value does not necessarily have to be treated (as of 2 April 2025).
Common
“More measurements are always better.”
Documented
The IQWiG states generally regarding screening: Not all screening examinations improve health. They may also be useless or even harmful (as of 30 September 2009). A second value is a methodological gain, not a health measure.
Common
“I can simply place two values side by side.”
Documented
Not without conditions. Iron levels fluctuate considerably over the course of a day, including after a meal (IQWiG, as of 20 March 2025). Two values measured under different conditions are two numbers without a common basis.
The core in one sentence
At this point, the topic can be brought together.
The second value makes the first interpretable. It does not replace it, nor does it confirm it.
This wording is deliberately cautious. A second value does not resolve a question; it turns it into one that can be answered.
The question about a number becomes a question about a direction, and directions are easier to put into context in a conversation than individual values. That is the entire benefit, and it is smaller than advertising for trend measurements usually promises.
What a second value cannot do
So that this article does not overstate the case in the other direction, the counter-list belongs here.
It gives no reason. Two values show that something has changed. No test result says why, and that is a question for a medical practice to clarify.
It does not replace an examination. IQWiG notes that a clear picture only emerges in conjunction with other values, symptoms, and examinations (as of March 20, 2025).
And it does not improve health by itself. The same institution writes about screening: detecting diseases early can only be useful if it enables them to be treated more effectively (as of September 30, 2009). A number alone changes nothing.
Three evidence-based points
Three pieces of information from the reviewed sources. They provide context and do not constitute a diagnosis.
Evidence-based information
95 %
of healthy measurements fall within the reference range – that is how its limits are defined (IQWiG, as of April 2, 2025)
10 % / 25 %
total cholesterol and triglycerides can vary within 24 hours in healthy people (MSD Manual, professional edition, as of December 2025)
3 months
HbA1c reflects a period of 3 months – a second value taken much earlier essentially still shows the same period (MSD Manual, as of December 2025)
The second and third points show the same thing from two sides. One value can fluctuate within a day without anything having changed, while another can remain unchanged for months even though something has changed.
And as with every laboratory value, the decisive factor is the reference range stated on your own test result, because reference values can vary from one laboratory to another (IQWiG, as of April 2, 2025).
What is needed for a reliable comparison
Placing two values side by side is only a comparison once certain conditions have been met.
First, the same laboratory, or at least the same reference range. Reference values can vary from one laboratory to another, and without this information, you are comparing two different scales rather than two values.
Second, comparable conditions. Iron levels temporarily rise after eating something (IQWiG, as of March 20, 2025). Vitamin D levels naturally decrease in winter and rise again in summer (IQWiG, as of November 15, 2023).
Third, enough time between measurements. If a value reflects a period of several months, repeating it soon afterward essentially still shows the same period.
Fourth, the same values. A test result with eighteen lines and one with three can only be compared where the lines overlap. Anyone planning to track a trend is better off measuring the same thing twice than measuring a lot once and a little once.
These four conditions may sound like extra effort, but in practice they amount to a single decision: do the same thing the second time as you did the first time. Everything else follows from that.
The interval that follows for each value is covered in the companion article How often to test blood values: what can be inferred.
Who a second result makes sense for
The comparison concerns the question of whether a second result will help you further.
Makes sense for you if …
You have an initial result and do not know whether it reflects a condition or is an outlier.
You have changed something about your diet or daily routine and know the baseline value.
You want to bring a direction rather than just a number to a consultation at the practice.
You want to document your values over the years as long as nothing is unusual.
Probably not if …
A finding is currently being medically evaluated. In that case, the practice that started the evaluation should take the lead.
You hope the second value will provide an explanation. No test result contains that.
The first value is only a few weeks old, while the value reflects several months.
You expect a diagnosis. That comes from a medical practice, not a self-test.
What a capillary blood test can show here
A capillary blood self-test does not provide a diagnosis and does not replace an examination. What it can do is record a value with a date and reference range that can be consulted again later.
VitalCheck by mybody®x (MYBODY Lab GmbH) measures 18 values from the same sample, all with the same date and laboratory. These two details are precisely what make a later comparison possible.
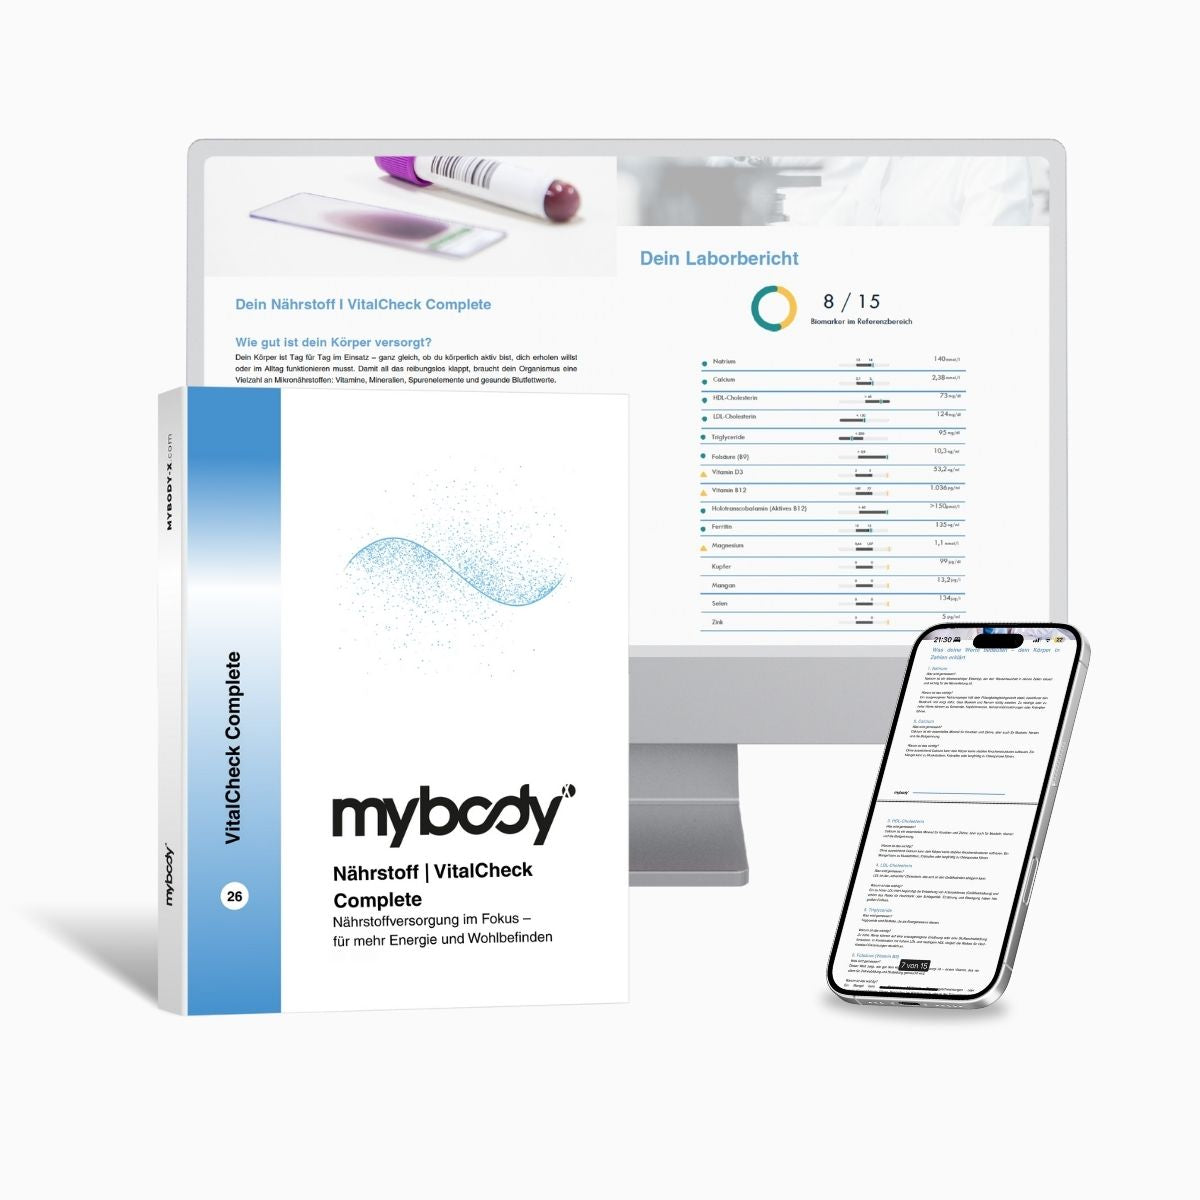
Capillary blood test
VitalCheck | Complete Nutrient & Mineral Test
Measures 18 values from the same sample, including 25-OH vitamin D3, vitamin B12, folic acid, ferritin, iron, transferrin, calcium, magnesium, phosphate, albumin, selenium, zinc, CRP, long-term blood sugar, and the cholesterol profile. What the test does not do: It does not specify a testing schedule, explain any changes, provide a diagnosis, or replace a medical examination. The reservations stated in our articles apply to individual values.
Laboratory analysis 3–5 business days after sample receipt
Product page information, accessed on 19 August 2026
Chapter at a glance
A capillary blood test records values with a date, laboratory, and reference range, thereby making a later comparison possible. It does not specify a testing schedule, explain any changes, or provide a diagnosis.
Limitations: what even two results leave open
The first limitation is cause. Two results show a direction but do not identify a cause. This question is clarified in a medical practice.
The second limitation is benefit. IQWiG notes regarding screening: Not all screening examinations improve health; they can also be useless or even harmful (as of September 30, 2009). One additional result is not a health benefit in itself.
The third limitation is comparability. Without the same laboratory, similar conditions, and sufficient time between tests, there is no valid comparison.
The fourth limitation is diagnosis. All the interpretations in this article provide context; they do not constitute a diagnosis. A diagnosis is made in a medical practice based on several components, and no self-test can anticipate it.
What matters for the second result
If you take away just one thing from this article, let it be this: A second result is not a better result, but a point of reference.
The reason lies in how the reference range is constructed. Its limits are set so that 95 percent of healthy measurements fall within it, meaning that 5 percent of healthy people fall outside it (IQWiG, as of April 2, 2025). A single result cannot distinguish between these two cases; two results taken at an interval can.
What does not follow from this is a testing schedule. This article specifies no interval, and IQWiG reminds us that more examinations do not automatically mean better health. What can be concluded from two results is determined in a medical practice.
Frequently asked questions
Why does a single laboratory result tell us so little?
Because it cannot distinguish between a condition and a snapshot in time. IQWiG notes: 5% of people have a result outside the reference range even though they are healthy (as of April 2, 2025). A single result contains no information about which group it belongs to.
Does a result outside the range mean that I am ill?
Not necessarily. The same source states that a deviating result does not necessarily need to be treated, and that an individual laboratory result is always only one component of an overall diagnosis (as of April 2, 2025). Interpretation belongs in a medical practice.
What do I need to make a reliable comparison between two results?
The same reference range, comparable conditions, and sufficient time between tests. Reference values may vary from one laboratory to another (IQWiG, as of April 2, 2025); iron levels temporarily increase after a meal (as of March 20, 2025); and vitamin D levels fluctuate seasonally (as of November 15, 2023).
Is testing more frequently automatically better?
No. IQWiG writes about screening: Not all screening examinations improve health. They can also be useless or even harmful (as of September 30, 2009). A second result is a methodological gain when interpreting the first, not a health measure in itself.
Does a second result indicate what caused a change?
No. It shows a direction, not a cause. IQWiG states that a clear picture only emerges in conjunction with other values, symptoms, and examinations (as of 20 March 2025). This overall assessment is a medical task.
Next step
Establish a reference point
The VitalCheck measures 18 values from capillary blood, all with the same date and laboratory. It does not specify a testing frequency, explain changes, provide a diagnosis, or replace medical evaluation.
To the VitalCheckRead more
You might also be interested in
The same idea applied to a single value.
The interval indicated by the values themselves.
Sources
- Institute for Quality and Efficiency in Health Care (IQWiG): Understanding laboratory values correctly, as of 2 April 2025 – gesundheitsinformation.de
- IQWiG: Screening examinations are not always useful, press release, as of 30 September 2009 – iqwig.de
- MSD Manual, Professional Edition: Dyslipidemia, Davidson MH and Altenburg A (as of December 2025) – msdmanuals.com
- MSD Manual, Professional Edition: Diabetes mellitus, Brutsaert EF (as of December 2025) – msdmanuals.com
- IQWiG: Iron, as of 20 March 2025 – gesundheitsinformation.de
- IQWiG: Vitamin D deficiency, as of 15 November 2023 – gesundheitsinformation.de
The verbatim quote about the 5 percent, the explanation of how reference ranges are determined, the figure of 95 percent, the statement about being one component of an overall diagnosis, and the statement that treatment is not necessarily required are taken from source [1]. The statements about the benefits of screening examinations are taken from [2]. The figures of 10 and 25 percent variation within 24 hours are taken from [3]. The information about the three-month period covered by HbA1c is taken from [4]. The statement about variation in iron levels after a meal and the statement about considering the overall picture are taken from [5]. The statement about seasonal variation in vitamin D levels is taken from [6]. Information on price, values, sample type, and laboratory comes from the mybody®x product page, accessed on 19 August 2026; processing times follow the central specifications for blood tests. All sources were accessed and reviewed on 19 August 2026.

mybody®x Editorial & Expert Team
Laboratory diagnostics Blood analysis interpretation Nutritional science Nutrigenetics
This article was created by the mybody®x editorial and expert team. The team combines laboratory diagnostics, nutritional science, and the interpretation of blood analyses. Everyone involved is listed on the authors’ page.
Published on 19 August 2026 · Last updated on 19 August 2026
The content is intended for general information and does not replace medical advice, diagnosis, or treatment. Reference ranges depend on the laboratory, method, and age; the information on your test report is always decisive.




Share now:
Calcium in the blood says little about the bones
The check-up from age 35: which values it includes